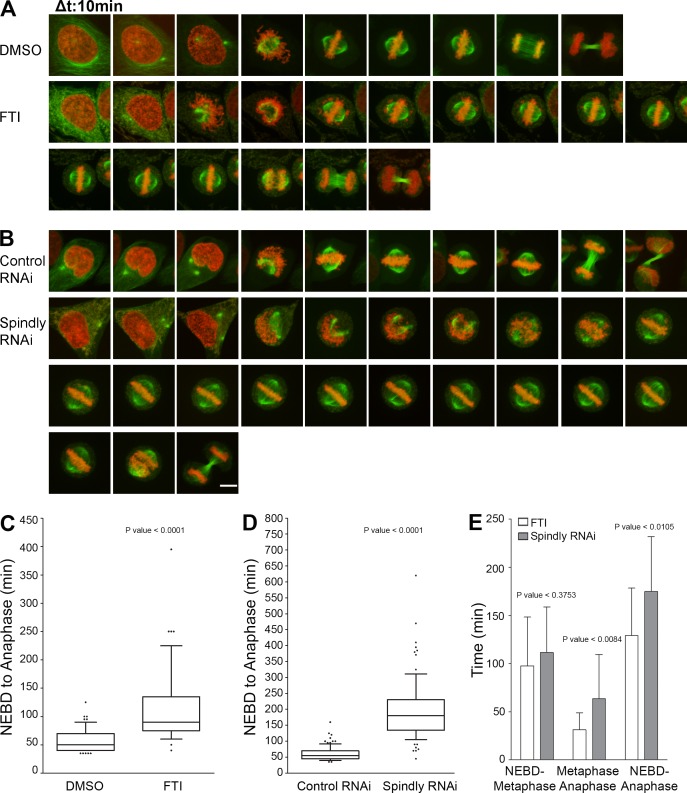
Figure 7.
Phenocopying of farnesylation inhibition with hSpindly knockdown by RNAi. (A) Representative stills from videos of GFP-tubulin and mCherry H2B expressing HeLa cells treated with either DMSO or 10 µM of FTI-L744832 for 24 h before filming. Time is shown in 10-min intervals. (B) Representative stills from videos of GFP-tubulin and mCherry H2B expressing HeLa cells treated with either control (scrambled) RNAi or hSpindly RNAi for 33 h before filming. Time is shown in 10-min intervals. Bar, 10 µm. (C) Box plots comparing the duration of nuclear envelope breakdown (NEBD) to anaphase between FTI- and DMSO-treated cells show significant mitotic delay in FTI-treated cells. Seven experiments were performed with >60 cells in total analyzed for each treatment. Boxes represent interquartile distributions and whiskers represent 10th and 90th percentiles. (D) Box plots comparing the duration of nuclear envelope breakdown to anaphase between control (scrambled) RNAi and hSpindly RNAi–treated cells show significant mitotic delay in hSpindly RNAi–treated cells. Eight experiments were performed with >80 cells in total analyzed for each treatment. Boxes represent interquartile distributions and whiskers represent 10th and 90th percentiles. (E) Duration of nuclear envelope breakdown to metaphase, metaphase to anaphase, and nuclear envelope breakdown to anaphase in FTI- and hSpindly RNAi–treated HeLa cells shows all are increased in Spindly knockdown cells with metaphase-to-anaphase time difference being significant. n = 18 for FTI and n = 22 for hSpindly RNAi. Error bars are SD from the means.

