Figure 2.
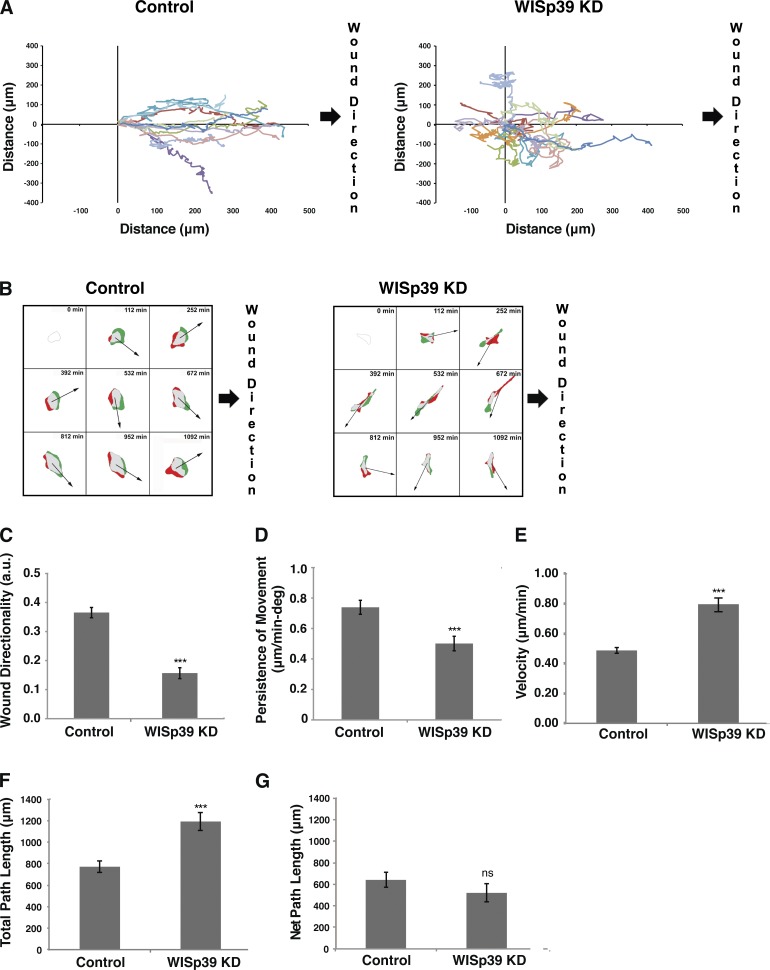
WISp39 KD cells exhibit decreased directional motility. (A) WISp39 KD leads to chaotic migration. U2OS cells plated on glass coverslips were transfected with either control or WISp39 siRNA. After 48 h, the cells were confluent, and migration was initiated by creating a wound with a pipette tip. 20× phase images were taken over after a 24-h period as described in the Materials and methods. The movements of individual representative cells, as shown, were obtained using MetaMorph nuclear tracking. WISp39 KD cells lacked directional movement toward the wound, which is on the right side of the frame. The data shown are from a single representative experiment (n = 10), out of three independent experiments. (B) Time-lapse videos were used to calculate protrusion differences as described in Materials and methods. Green areas are the protruded areas, and red areas are the retracted areas calculated between four successive frames of 7-min intervals each (i.e., the 28 min preceding the tile image) beginning at the 112-min mark. Arrows indicate the direction of cell movement averaged from four successive frames. Time between tiles is 140 min. Expected direction of migration toward wound closure is on the right side of each frame. Note that WISp39 KD cells did not consistently move in a defined direction relative to the protrusion. (C) Quantitation of directionality in actively migrating cells collected using DIAS software. Directionality is a measure of path variance from the central axis of the wound. Number of control and WISp39 KD cells scored is 25 each from three independent experiments. a.u., arbitrary units. (D) Quantitation of persistence in actively migrating cells. Persistence is the ratio of net translocation distance to the total length of migration. Number of control and WISp39 KD cells scored is 25 each from three independent experiments. deg, degree. (E) Quantitation of velocity in actively migrating cells. Velocity was measured using the central difference method as described in the DIAS manual. The number of control and WISp39 KD cells scored is 25 each from three independent experiments. (F) Quantitation of total path length, the distance the cell traveled from the first frame to the last frame taken as a straight line approximation every four frames. The number of control and WISp39 KD cells scored is 25 each from three independent experiments. (G) Quantitation of net path, the distance from the starting frame to the last frame. The number of control and WISp39 KD cells scored is 25 each from three independent experiments. Data shown in C–G represent the means ± SD. Student’s t test; ***, P ≤ 0.001.

