Figure 4.
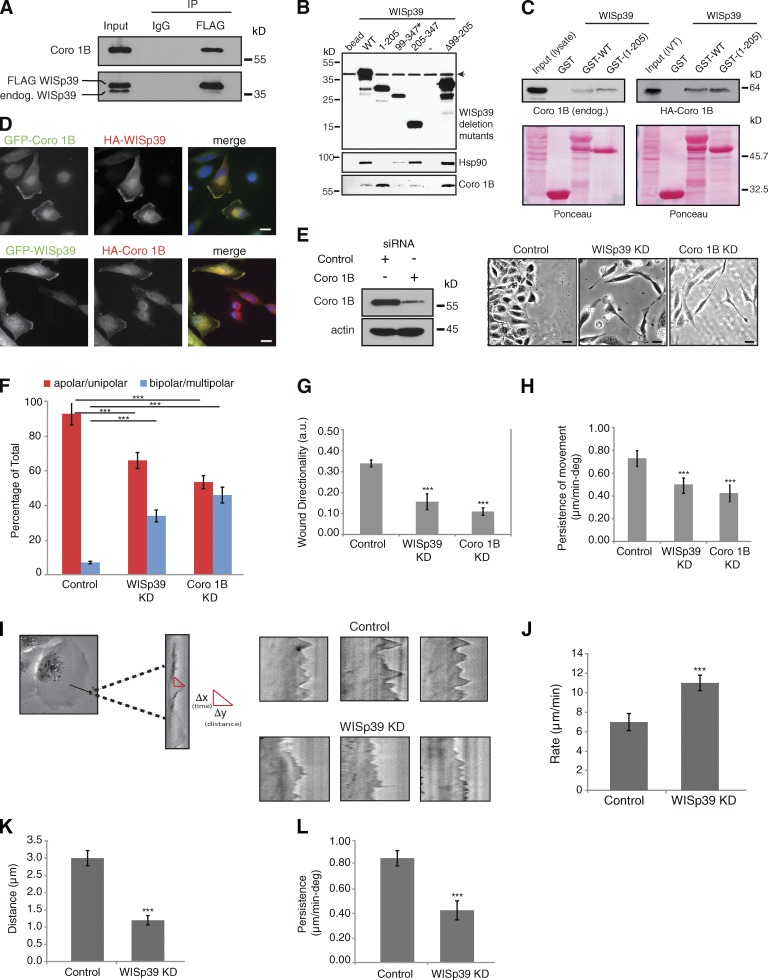
Coronin 1B binds to WISp39 and colocalizes with WISp39. (A) Coronin 1B (Coro 1B) binds WISp39. Extracts from U2OS cells transfected with FLAG-WISp39 were immunoprecipitated (IP) with either anti-FLAG or mouse IgG and subsequently Western blotted for associated endogenous Coronin 1B (top) and WISp39 (bottom). The experiment was repeated three times with similar results. endog., endogenous; IP, immunoprecipitation. (B) Mapping of the Coronin 1B binding region in WISp39. HEK293 cells were transfected with HA-tagged WISp39 WT or WISp39 truncation mutants. WISp39 and its associated proteins were isolated as described in the Materials and methods. The bound proteins were detected by Western blotting. Coronin 1B binds residues 1–98 of WISp39. Mutant 99–347 (asterisk) is only present in the nucleus, whereas the other WISp39 mutants and the WT WISp39 are both nuclear and cytoplasmic. Mutant Δ99–205 lacks residues 99–205 of WISp39. Arrow indicates a nonspecific band. Minus sign indicates another control lane. (C) In vitro binding of WISp39 to Coronin 1B. (left top) HeLa cell lysates were incubated with bacterially expressed GST-WISp39 WT or GST-WISp39(1–205) bound to glutathione-Sepharose, and the associated Coronin 1B was detected by Western blotting with Coronin 1B–specific antibodies. (right top) In vitro transcribed and translated (IVT) HA–Coronin 1B was incubated with GST-WISp39 WT or GST-WISp39(1–205) bound to glutathione-Sepharose, and the associated HA–Coronin 1B was detected by Western blotting with HA-specific antibodies. Ponceau staining of the nitrocellulose membranes is shown. The association of IVT HA–Coronin 1B with GST-WISp39 WT or GST-WISp39(1–205) is not notably different (right), perhaps because cellular proteins that associate with WT WISp39–Hsp90 reduce the fraction of WISp90–Hsp90 complex available for binding Coronin 1B. The experiments were repeated more than three times with similar results. (D) WISp39 colocalizes with Coronin 1B at the leading edge. HeLa cells were transfected with GFP–Coronin 1B and HA-WISp39 or HA–Coronin 1B and GFP-WISp39. Cells were fixed and stained with the anti-HA antibody. Bars, 10 µm. (E) Loss of Coronin 1B yields a morphology similar to WISp39 KD. U2OS cells transfected with either control siRNA or Coronin 1B siRNA or WISp39 siRNA for 48 h were wounded as in Fig. 2 A and then imaged. Phase-contrast images (20×) of Coronin 1B KD and WISp39 KD show elongated and multipolar morphology. Western blot shows KD of Coronin 1B at 48 h. Actin is a loading control. Bars, 10 µm. (F) Quantitation of Coronin 1B KD morphology. U2OS cells transfected with either control siRNA or Coronin 1B siRNA or WISp39 siRNA for 48 h were wounded as in Fig. 2 A. Cells were scored from phase-contrast images (20×) as either apolar/unipolar or bipolar/multipolar and are presented as a percentage of total cells scored from more than three independent experiments (control = 200, Coronin 1B KD = 404, and WISp39 KD = 258). Note that the cells were scored after wounding; therefore, they are somewhat constrained from producing multipolar morphology by the surrounding cells, unlike sparsely plated cells in Fig. 1 B. Thus, there are fewer multipolar cells in comparison to Fig. 1 B. (G and H) Decrease in directionality and persistence of movement in Coronin 1B KD cells. Quantitation of motility parameters was performed as in Fig. 2. Number of cells scored from three independent experiments: control (20); Coronin 1B KD (20); WISp39 KD (20). a.u., arbitrary unit. (I) Kymograph analysis. (left) A magnified region of the cell is outlined in the rectangular box. Sample kymographs for control and WISp39 KD cells are shown on the right. Experimental parameters are detailed in J–L. (J–L) Protrusion parameters of control and WISp39 KD cells. Kymographs were constructed along a 1-pixel-wide axis oriented in the direction of the protrusion and perpendicular to the edge of the lamellipodia using MetaMorph software. Rate, distance, and persistence of protrusions were calculated from the distance of protrusion (y axis) and time (x axis). Δy = distance of lamellipodia protrusions; Δx = persistence (time) of lamellipodia protrusions; Δy/Δx = rate of lamellipodia protrusions. 10 cells from three independent experiments (8–10 protrusions/cell) were analyzed. deg, degree. Data shown in F–H and J–L represent the means ± SD. (F–H) ANOVA followed by Tukey’s test; ***, P ≤ 0.001. (J–L) Student’s t test; ***, P ≤ 0.001.

