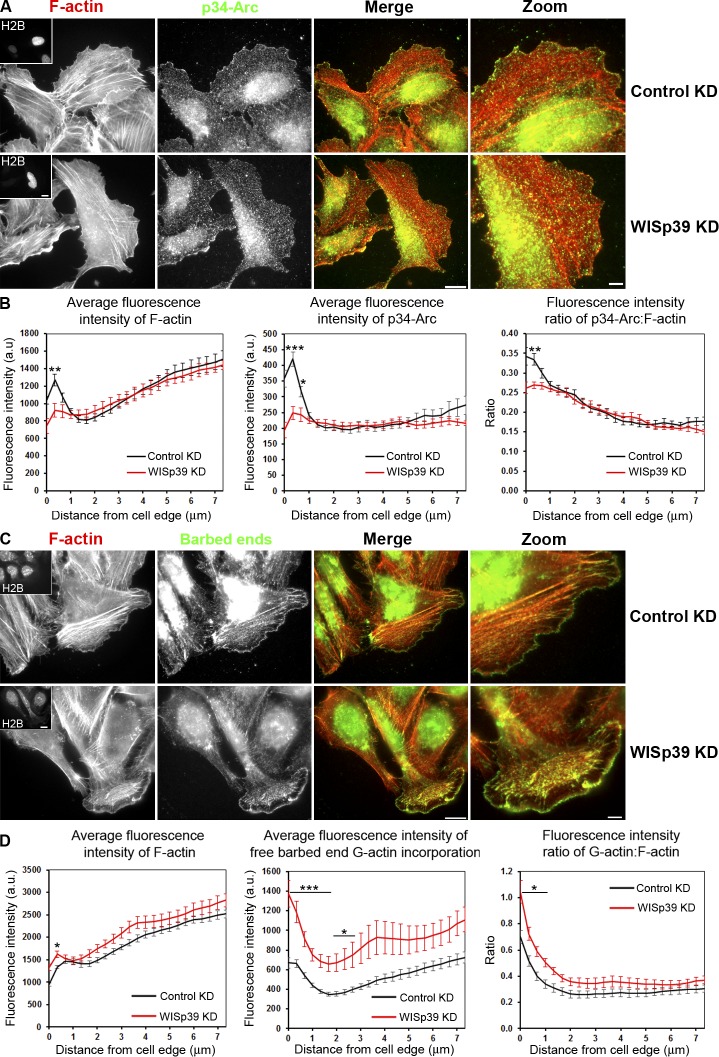
Figure 6.
WISp39 KD decreases the localization of Arp2/3 complex and increases the generation of free barbed ends at the cell leading edge. (A) WISp39 KD decreases Arp2/3 complex localization at the cell leading edge. Immunolocalization of the Arp2/3 subunit p34-Arc and F-actin phalloidin staining in cells transfected for 48 h with control or WISp39 siRNA. U2OS cells were transfected with WISp39 siRNA in combination with a GFP plasmid expressing histone H2B to visualize transfected cells. After 48 h, the cells were fixed, and immunofluorescence images were acquired as described in Materials and methods. Insets in the first image show a cell expressing GFP-H2B, cotransfected with the siRNA. Magnified regions are shown in the right-most image. (B) Quantification of fluorescence intensity (±SEM) of F-actin, p34-Arc, and ratio of p34-Arc/F-actin in control and WISp39-depleted cells, measured from the cell edge (0) to the cell center (7 µm). Bands of constant distance to the cell edge were constructed, and individual fluorescence intensities were accumulated and averaged in each band to produce graphs of fluorescence intensities versus distance to the cell edge (Fig. S5). The data shown represent one experiment and are averaged from n ≥ 11 cells for each condition. Only cells with a spread morphology have been included. Student’s t test; *, P ≤ 0.05; **, P ≤ 0.01; ***, P ≤ 0.001 compared with control siRNA cells. The experiment was repeated three times, with similar results. (C) G-actin incorporation marking free barbed ends and F-actin phalloidin staining in cells transfected for 48 h with control or WISp39 siRNA. U2OS cells were transfected with WISp39 siRNA in combination with GFP plasmid expressing histone H2B for 48 h, and immunofluorescence localization of barbed ends was performed by live-cell microscopy. Insets in the first image show the expression of H2B, cotransfected with the siRNA. Magnified regions are shown in the right-most image. WISp39 depletion induces the formation of free barbed filament ends. (D) Quantification of fluorescence intensity of F-actin, free barbed ends, and the ratio of free barbed ends: F-actin in control and WISp39 KD cells, measured from the cell edge (distance = 0) to the cell center (7 µm). Quantitation was performed as in B. The data shown represent one experiment and are averaged from n ≥ 15 cells for each condition (±SEM). Only cells with a spread morphology have been included. Student’s t test; *, P ≤ 0.05; ***, P ≤ 0.001 compared with control siRNA cells. The experiment was repeated four times, with similar results. The mean fluorescent F-actin intensity is elevated slightly relative to B, and this variation may arise because the analysis in B was performed on fixed cells. a.u., arbitrary unit. Bars: (left images and insets) 15 µm; (zoom images) 5 µm.

