. 2015 Mar 3;4:e05166. doi: 10.7554/eLife.05166

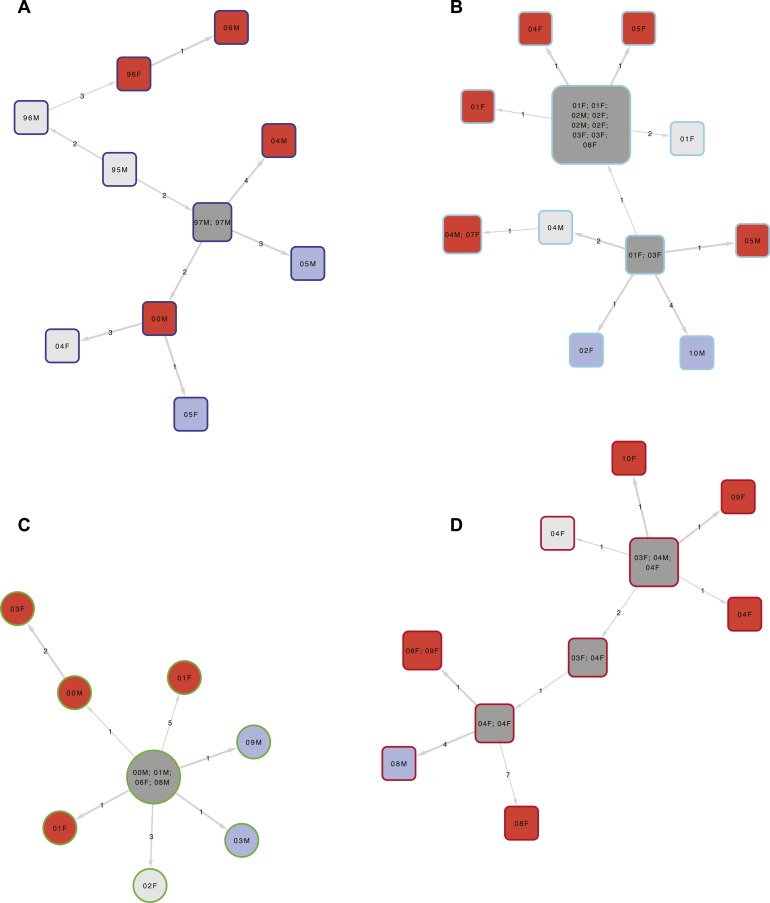
Figure 3. Examples of clusters built using SeqTrack.

All clusters are shown in Figure 3—figure supplement 1. Each polygon represents a patient, with larger polygons representing two or more patients with identical sequences. The patient details are written inside the polygon: F = female, M = male. The number is the year of the start of the disease episode. The shapes describe drug resistance of the strain: squares = drug sensitive, circles = drug resistant. The colour of the polygon refers to HIV status of the patient: red = positive, blue = negative, grey = unknown (or multiple patients). The colour of the edge refers to the lineage: Lineage 1 (Indo Oceanic) dark blue (B), Lineage 2 (Beijing/East Asian) light blue (C), Lineage 3 (East African Indian) green (A), and Lineage 4 (Europe American) red (D). The numbers on the arrows between the polygons are the number of SNPs between them.

DOI: http://dx.doi.org/10.7554/eLife.05166.007

Figure 3.

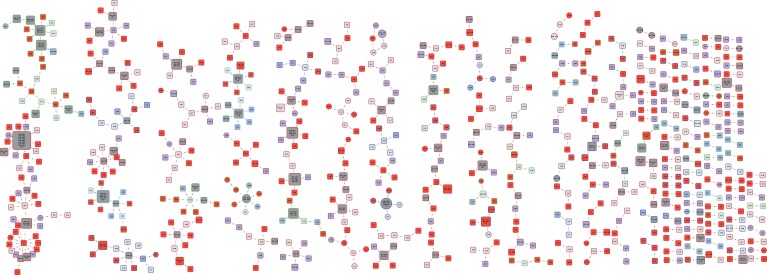
Figure 3—figure supplement 1. Clusters built using SeqTrack.

Figure 3—figure supplement 1.

Each polygon represents a patient, with larger polygons representing two or more patients with identical sequences. The patient details are written inside the polygon: F = female, M = male. The number is the year of the start of the disease episode. The shapes describe drug resistance of the strain: squares = drug sensitive, circles = drug resistant, octagons = unknown. The colour of the polygon refers to HIV status of the patient: red = positive, blue = negative, grey = unknown. The colour of the edge refers to the lineage: Lineage 1 (Indo Oceanic) dark blue, Lineage 2 (Beijing/East Asian) light blue, Lineage 3 (East African Indian) green, and Lineage 4 (Europe American) red. The numbers on the arrows between the polygons are the number of SNPs between them.