. 2015 Mar 3;4:e05166. doi: 10.7554/eLife.05166

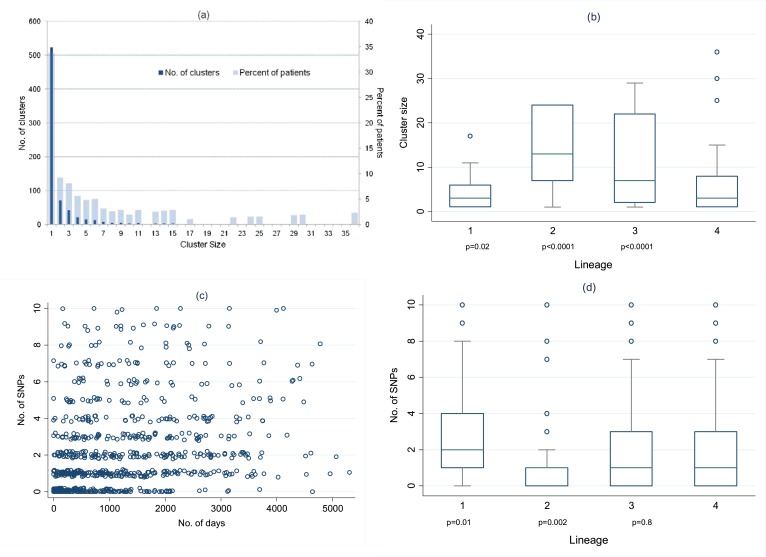
Figure 4. Distribution of clusters and SNPs.

(A) Number of clusters of different sizes and percentage of patients in clusters of different sizes. Cluster size 1 refers to unclustered patients. (B) Cluster size by lineage. The p values are for the comparison of each lineage with lineage-4 (Wilcoxon rank sum test). (C) Relationship between number of SNPs between individuals and the time interval between disease onset in each individual of the pair. (Random noise has been introduced to allow multiple similar results to be visualized.) Linear regression gives r2 = 10%, p < 0.001, slope 0.26 SNPs per year (95% CI 0.21–0.31). (D) Number of SNPs between individuals in clusters, by lineage. The p values are for the comparison of each lineage with lineage-4 (Wilcoxon rank sum test).

DOI: http://dx.doi.org/10.7554/eLife.05166.009

Figure 4.

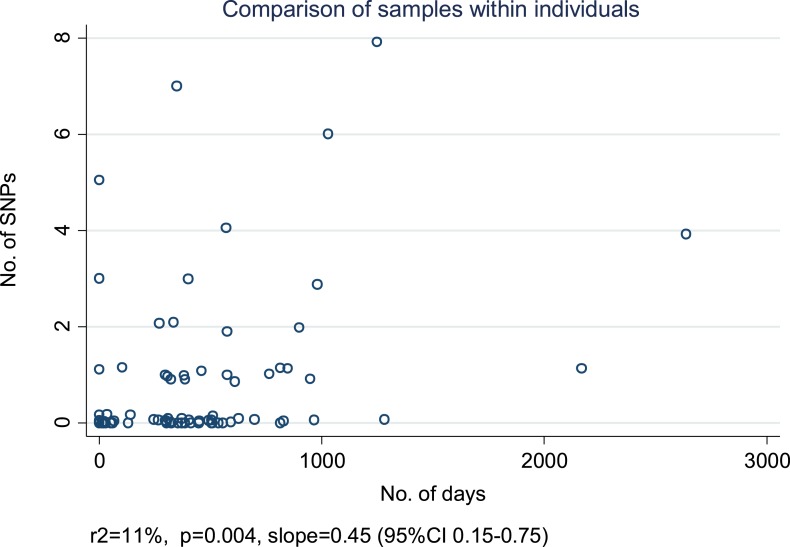
Figure 4—figure supplement 1. Relationship between number of SNPs and the number of days between samples from individuals with more than one specimen available from the same of episode of disease or from a relapse.

Figure 4—figure supplement 1.

For each individual, we selected the first and last specimens if there were more than two. (Random noise has been introduced to allow multiple similar results to be visualized.) The slope is given in SNPs/year.
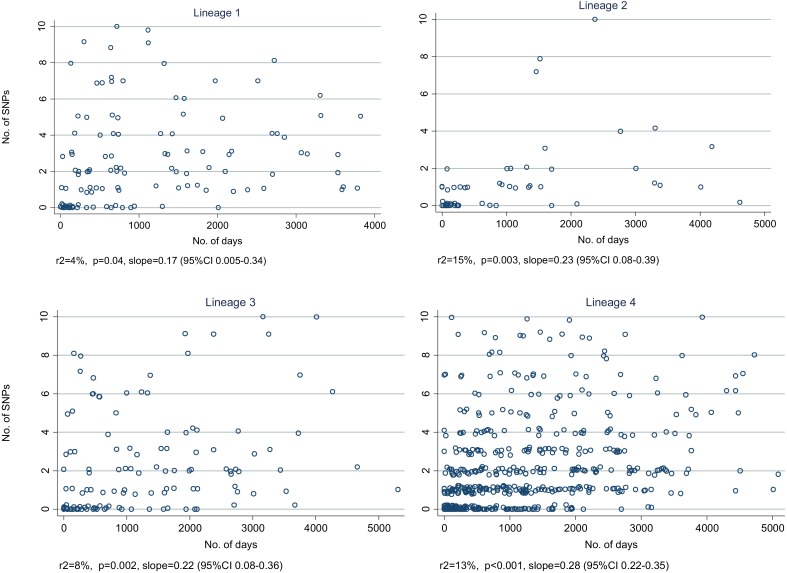
Figure 4—figure supplement 2. Relationship between number of SNPs and the number of days between dates of disease onset for transmissions identified from the network, by lineage.

Figure 4—figure supplement 2.

(Random noise has been introduced to allow multiple similar results to be visualized.) The slopes are given in SNPs/year.