. 2015 Feb 4;4:e06156. doi: 10.7554/eLife.06156

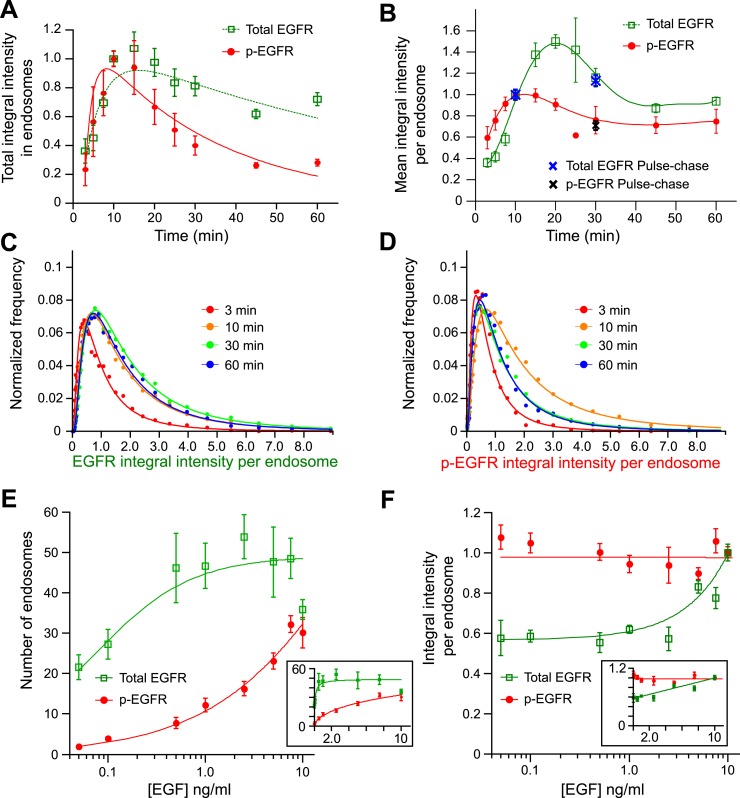
Figure 1. Cells keep a constant amount of p-EGFR in endosomes.

(A) Time course of total integral intensity of EGFR (green) and p-EGFR (red) in endosomes measured by a FRET microscopy assay in HeLa EGFR BAC cells after continuous stimulation with 10 ng/ml EGF. The total integral intensity is defined as the sum of integral intensities of all endosomes in an image normalized by the area covered by the cells (for details see ‘Materials and methods’ and Supplementary information). (B) Time course of mean integral intensity per endosome for total EGFR (green curve) and p-EGFR (red curve) as in (A). Intensity curves (AB) were normalized to the intensity value at 10 min. Crosses show the corresponding values after 1 min of EGF stimulation and incubation in ligand-free medium for 10 or 30 min (pulse-chase). (C) Time course of histogram distributions of the total EGFR integral intensity per endosome upon EGF stimulation as in (A). (D) Time course of histogram distributions of the p-EGFR integral intensity per endosome upon EGF stimulation as in (A). In both graphs, receptors in CCVs are responsible for the width of the distribution at 3 min (red curves in C and D). For comparison, histogram amplitude in B and C were normalized by each curve integral. In each graph, the integral intensity values were scaled by the mode of the histogram at 10 min. The experimental points from all histograms were fitted with a log-normal distribution. (EF) Distribution of p-EGFR in endosomes as a function of EGF concentration after continuous stimulation for 30 min. Mean number of endosomes with EGFR (green curve) and p-EGFR (red curve) per 1000 μm2 of the area covered by cells (E) and mean integral intensity of EGFR (green curve) and p-EGFR (red curve) per endosome (F). On panel (F) curves were normalized to the intensity value at 10 ng/ml EGF. Lines are hyperbolic fits (E) or least square fits (F) to the experimental points. In both cases insets show the same graphs in linear scale. The different magnitude of the error bars in (E) and (F) is due to the averaging by the total number of images (E) or the total number of endosomes (F). In all cases, points show mean ± SEM. All measurements were done in three independent experiments with a total of ∼150 cells per time point or condition.

DOI: http://dx.doi.org/10.7554/eLife.06156.004

Figure 1.

Figure 1—figure supplement 1. Bleed-through correction for p-EGFR detection by FRET microscopy.

Figure 1—figure supplement 1.

(A) Representative image of HeLa cells with no EGFR-GFP expression stained with an anti-p-Tyr antibody directly labelled with AlexaFluor 555 used to quantify the amount of fluorescence bleed-through. Scale bars, 10 μm. (B) Distribution of the ratio of FRET-p-Tyr maximum intensities of individual colocalized objects in the FRET and p-Tyr channel. Since there is no GFP fluorescence, these objects give an estimation of fluorescence bleed-through (filled circles). The continuous black line is the fit of three Gaussian components (shown in coloured dashed lines). The mean and variance of the red and blue curves were used for image corrections (see ‘Materials and methods’ for details). (C) Mean FRET-p-Tyr intensity distribution before (black curve) and after correction (red curve).

Figure 1—figure supplement 2. EGFR and p-EGFR measurements by FRET microscopy.

Figure 1—figure supplement 2.

(A) Representative images of HeLa EGFR-GFP BAC cells after continuous stimulation with 10 ng/ml EGF for the indicated time points. EGFR-GFP fluorescence is shown in green, the corrected p-EGFR intensity is shown in red, and DAPI-stained nuclei are shown in blue. Measurements from each individual endosome were used for all quantifications. Scale bars, 10 μm. (BC) Time course of histogram distributions of the total p-EGFR (B) or EGFR (C) integral intensity per endosome upon EGF stimulation as in Figure 1. The histogram shows the number of vesicles per 1000 μm2 of the area covered by cells. Intensity values were scaled by the mode of the histogram at 10 min. In all graphs, experimental points were fitted with a log-normal distribution. Points show the mean from three independent experiments with a total of ∼150 cells per time point or condition.

Figure 1—figure supplement 3. BAC expression of EGFR-GFP does not change EGF transport kinetics.

Figure 1—figure supplement 3.

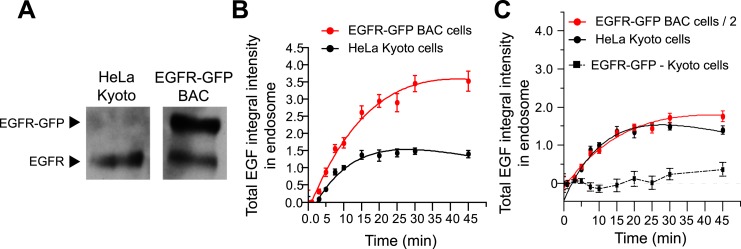
(A) Representative Western blot of comparing the expression of EGFR and EGFR-GFP in HeLa Kyoto and HeLa EGFR-GFP BAC cells. The lower band corresponds to the untagged receptor, whereas the upper band corresponds to EGFR-GFP, which is absent in HeLa Kyoto cells. (B) Time course of EGF integral intensity in endosomes in HeLa Kyoto (black curve) and HeLa EGFR-GFP BAC cells (red curve). Intensity curves were normalized to the intensity value at 10 min for HeLa Kyoto cells. (C) Comparison of both time courses after dividing the HeLa EGFR-GFP BAC cells by 2. Squares show the difference between both curves. Experimental points show mean ± SEM from one representative experiment with a total of ∼150 cells per time point and condition. Time courses were fitted as in Figure 1.

Figure 1—figure supplement 4. Validation of FRET measurements with a specific anti-Tyr1068 antibody.

Figure 1—figure supplement 4.

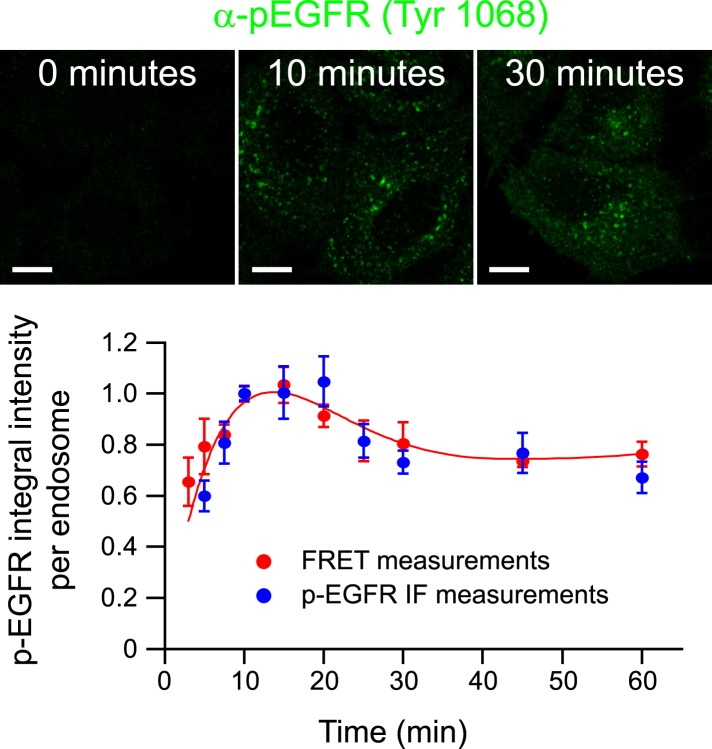
Representative images of p-EGFR staining by an antibody against a single phospho-tyrosine residue of EGFR after 0, 10, and 30 min of continuous stimulation with 10 ng/ml EGF. Scale bars, 10 μm. Time course of the p-EGFR mean integral intensity per endosome measured by standard immunofluorescence (blue) and by FRET assay (red). For comparison, both curves were normalized to the value at 10 min. Experimental points were fitted as in Figure 1A.

Figure 1—figure supplement 5. PFA fixation does not significantly change endosome EGFR endosome morphology.

Figure 1—figure supplement 5.

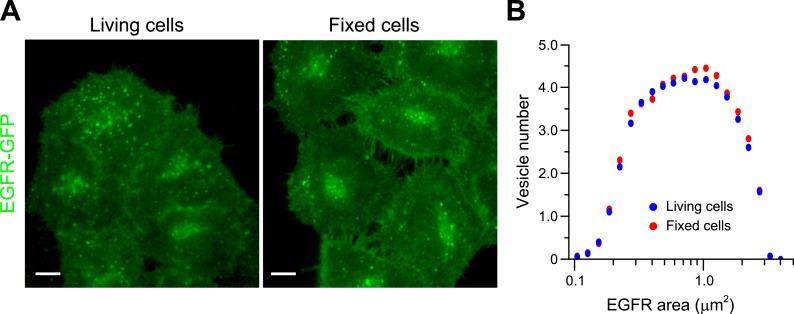
(A) Representative images of HeLa BAC cells expressing EGFR-GFP after 20 min of stimulation with 10 ng/ml EGF before (left panel) or after fixation (right panel). Scale bars, 10 μm. (B) Histogram distribution of EGFR endosome area before (blue) and after fixation (red). The histogram shows the number of EGFR endosomes per 1000 μm2 of the area covered by cells. Measurements were taken from ∼500 cells from one representative experiment.

Figure 1—figure supplement 6. The total amount of p-EGFR in endosomes decays with the same kinetics as the number of endosomes with p-EGFR.

Figure 1—figure supplement 6.

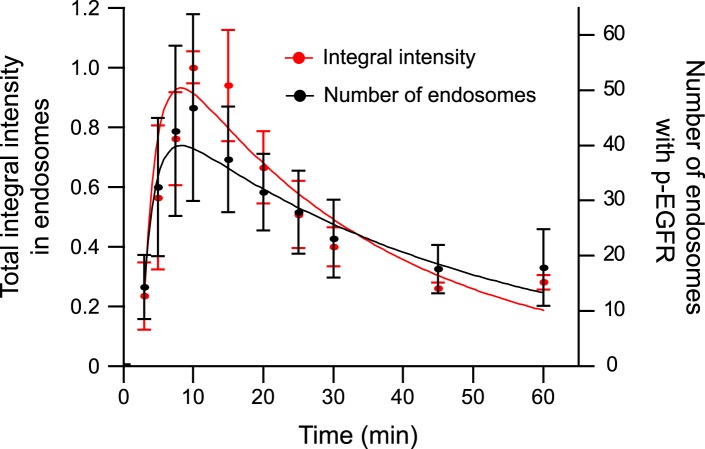
Time course of total integral p-EGFR intensity in endosomes (red) and endosomes with p-EGFR (black) per 1000 μm2 of the area covered by cells (black) after stimulation with 10 ng/ml EGF as in Figure 1. Points show mean ± SEM. All measurements were done in three independent experiments with a total of ∼150 cells per time point or condition.

Figure 1—figure supplement 7. p-EGFR has a narrower integral intensity per endosome distribution than the total EGFR at late time points.

Figure 1—figure supplement 7.

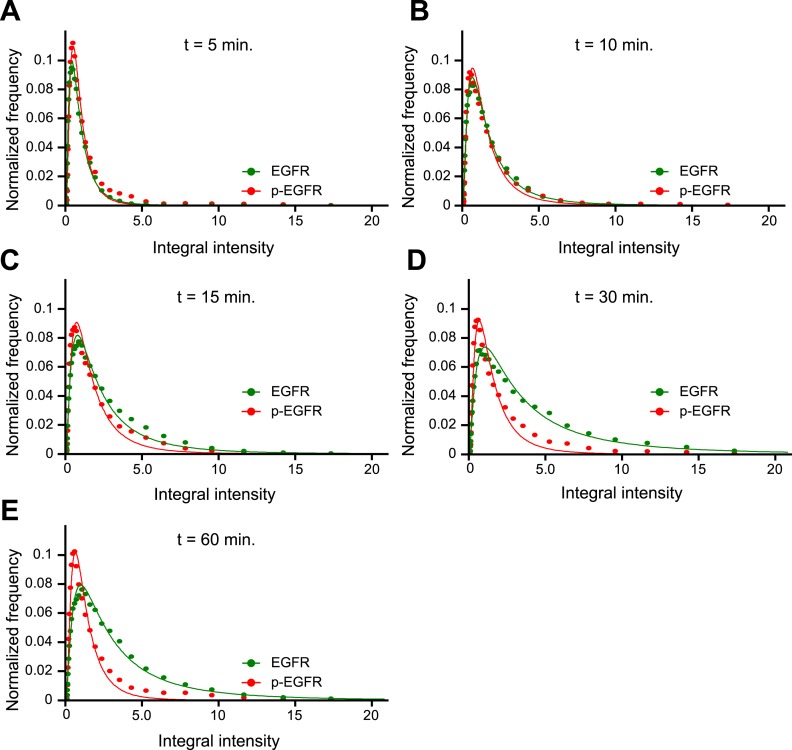
(AE) Histogram distributions for the p-EGFR (red) or total EGFR (green) integral intensity per endosome at 5 (A), 10 (B), 15 (C), 30 (D), and 60 (E) min of continuous stimulation with 10 ng/ml EGF. For comparison, the amplitude of all histograms was normalized by the curve integral and the integral intensity was scaled by the mode of each histogram. In all graphs, experimental points were fitted with a log-normal distribution. Points show the mean from three independent experiments with a total of ∼150 cells per time point or condition.
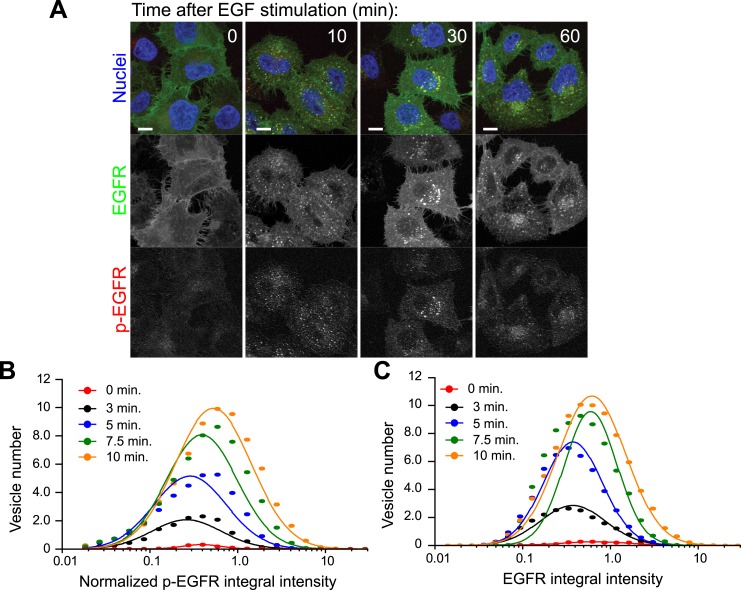
Figure 1—figure supplement 8. The mean amount of p-EGFR per endosome increases at high concentrations of EGF.

Figure 1—figure supplement 8.

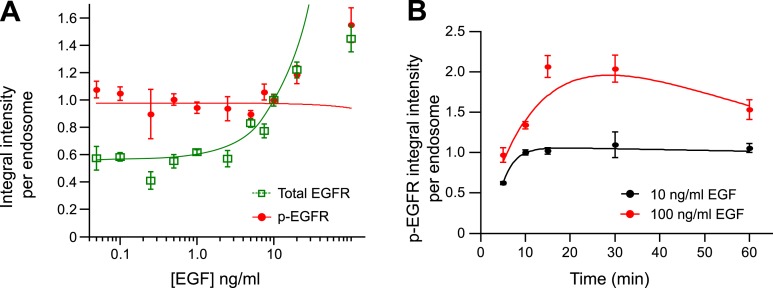
(A) Mean integral intensity of EGFR (green curve) and p-EGFR (red curve) per endosome upon stimulation with different EGF concentrations for 30 min (B) Time course of mean integral intensity of p-EGFR per endosome after continuous stimulation with 10 ng/ml (black curve) or 100 ng/ml (red curve) EGF. Curves were normalized by the intensity value at 10 min for 10 ng/ml EGF. Experimental points were fitted as in Figure 1A.

Figure 1—figure supplement 9. The mean p-EGFR amount per endosome does not correlate with endosome area at late time points after EGF stimulation.

Figure 1—figure supplement 9.

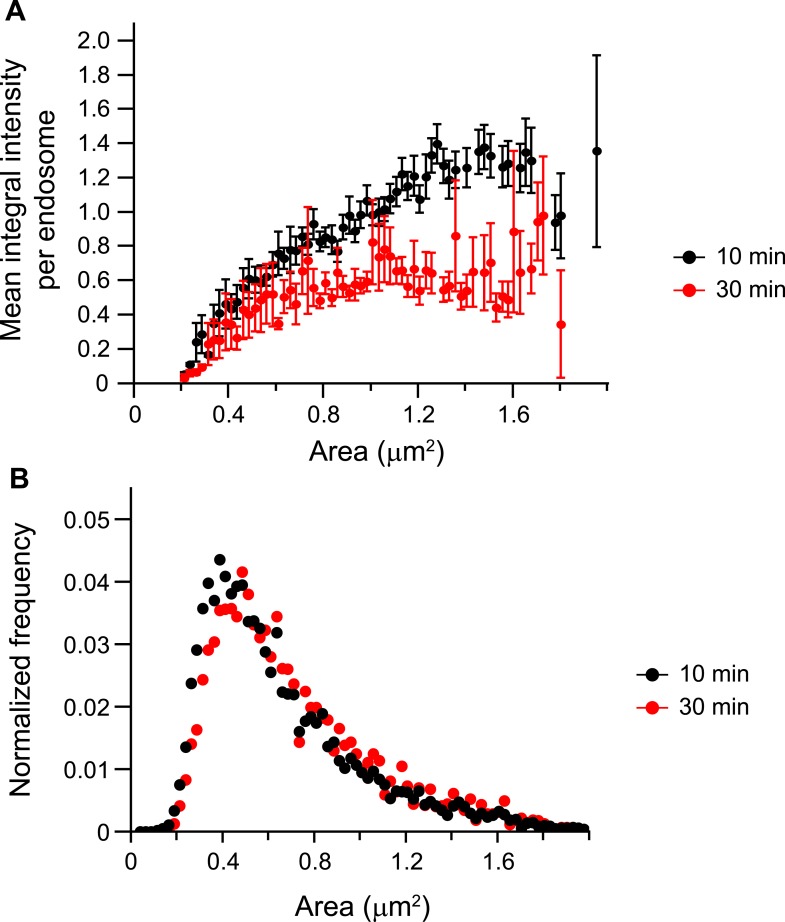
(A) Mean p-EGFR integral intensity per endosome as a function of endosome area upon 10 (black curve) or 30 min (red curve) of EGF stimulation. Both curves were normalized to the intensity value at 1 μm2 for 10 min stimulation. (B) Histogram distribution of endosome area upon 10 (black curve) or 30 min (red curve) of EGF stimulation. Each histogram was normalized by its respective curve integral. Points show mean ± SEM. All measurements were done in three independent experiments with a total of ∼150 cells per time point or condition.