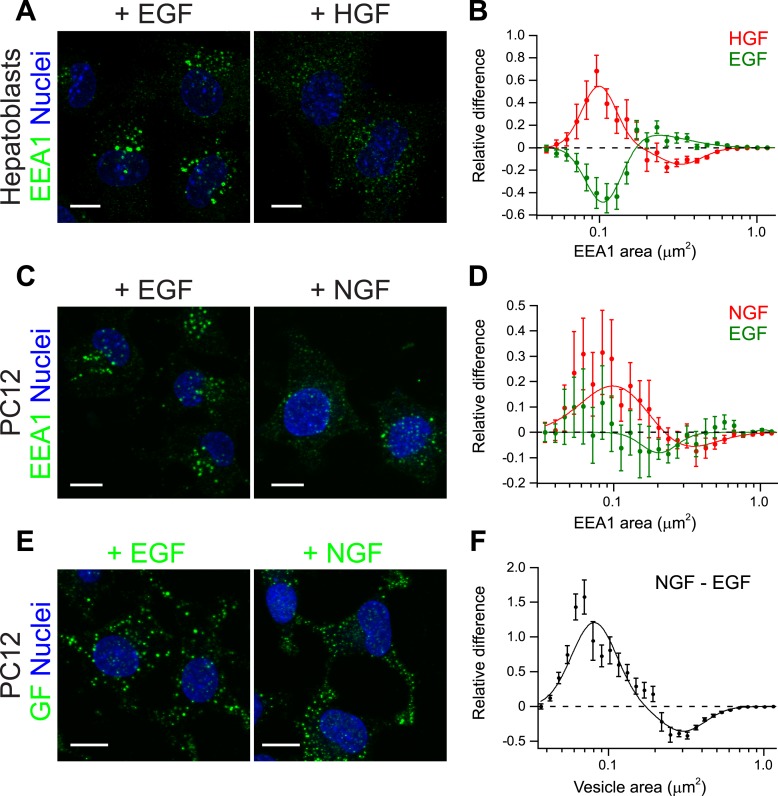
Figure 6. Growth factors differentially shift the distribution of the number and size of endosomes.
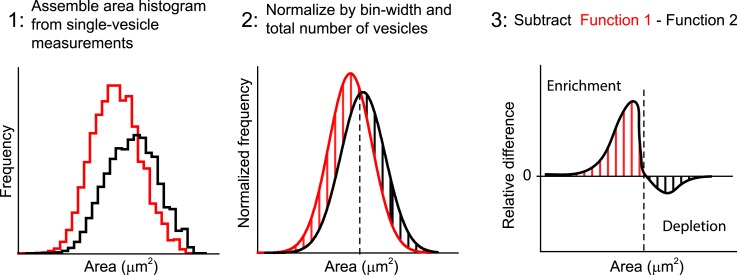
(A) Representative images of primary mouse hepatoblasts after stimulation with 10 ng/ml EGF or HGF for 30 min (B) Shift in the EEA1-positive endosome area distribution after stimulation with HGF (red curve) or EGF (green curve). The values of the histograms of endosome area distribution for growth factor stimulated and non-stimulated cells were normalized and subtracted. The curve shows the relative increase (above zero) or reduction (below zero) in the number of endosomes for each area bin (in logarithmic scale). HGF stimulation increased while EGF decreased the proportion of endosomes smaller than 0.2 μm2. (C–F) PC12 cells after stimulation for 30 min with 100 ng/ml EGF or 50 ng/ml NGF. (C) Representative images of EEA1-positive endosomes. (D) Shift in the EEA1-positive endosome area distribution after stimulation with NGF (red curve) or EGF (green curve) measured as in (B). NGF stimulation increased while EGF slightly decreased the proportion of endosomes smaller than 0.2 μm2. (E) Representative images of EGF or NGF. (F) Differences in the area distribution of endosomal NGF and EGF measured as in (B). NGF is enriched in endosomes smaller than 0.2 μm2 relative to EGF. For all graphs points show the mean ± SEM of experimental distributions. Measurements were done in three independent experiments with n ∼150 cells per condition. In all graphs, experimental points were fitted with two log-normal distributions. Image scale bars, 10 μm.


