. 2015 Feb 4;4:e06156. doi: 10.7554/eLife.06156

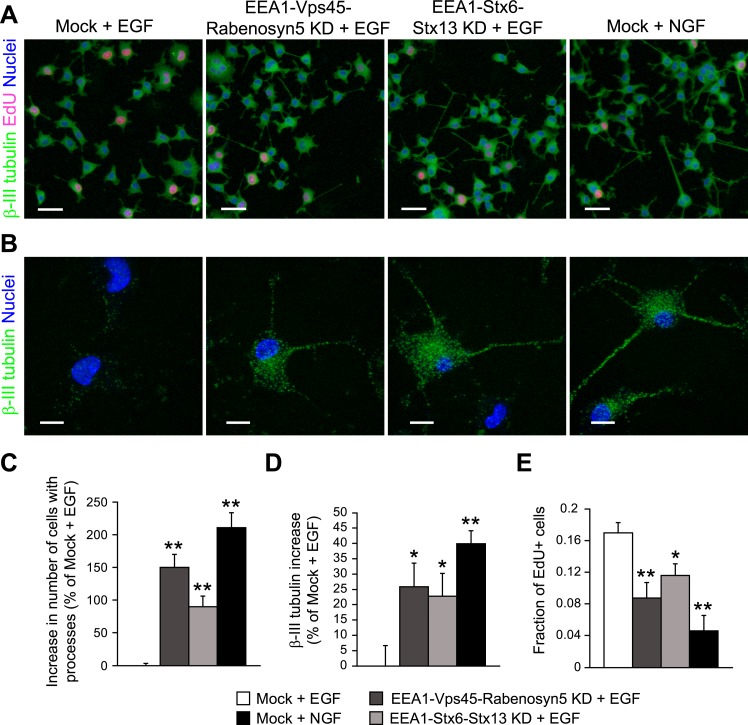
Figure 7. Redistribution of endosomal EGF is sufficient to trigger neuronal differentiation in PC12 cells.

(AB) Representative images of PC12 cells after partial protein depletion of either EEA1, Rabenosyn5, and Vps45 or EEA1, Syntaxin-6, and Syntaxin-13, or mock treatment and stimulation with 100 ng/ml EGF or 50 ng/ml NGF for 24 hr. Scale bars, 50 μm. (B) A high-resolution image of single cells to highlight the changes in β-III tubulin expression and neurite formation. β-III tubulin is shown in green, nuclei are shown in blue, and EdU-positive nuclei are shown in pink. Scale bars, 10 μm. Note that in Figure 6C,E, the short incubation times did not permit neurite outgrowth. (C) Increase in the number of cells with β-III tubulin-positive processes longer than 1 μm compared to mock-treated cells after EGF stimulation. (D) Increase in β-III tubulin expression measured by the total intensity of the cytoplasmic β-III tubulin immunostaining. The total intensity per image was normalized by the image area covered by cells. (E) Number of proliferating cells measured by EdU incorporation. The number of EdU-positive nuclei was divided by the total number of nuclei. In all cases, data show mean ± SEM. For each parameter, pair-wise comparisons were done against EGF-stimulated mock-treated cells. *p < 0.05, **p < 0.005 by Fisher's LSD test. All measurements were done in three independent experiments with a total of ∼15000 cells per condition.

DOI: http://dx.doi.org/10.7554/eLife.06156.034

Figure 7.

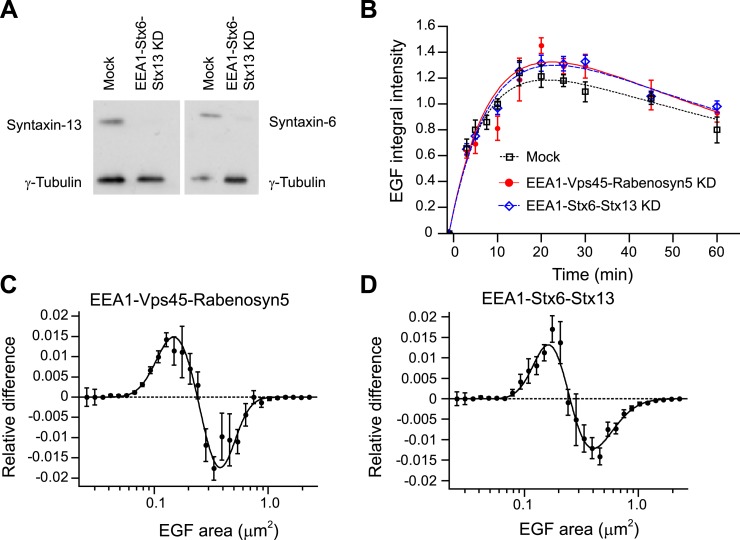
Figure 7—figure supplement 1. Knock-down of fusion machinery redistributes endosomal EGF in PC12 cells.

Figure 7—figure supplement 1.

(A) Partial protein depletion of Syntaxin-6 and Syntaxin-13 72 hr after electroporation. Protein reduction of EEA1 and Rabenosyn5 was similar to that in HeLa cells (not shown). (B) Time course of EGF integral intensity in endosomes after EEA1, Rabenosyn5, and Vps45 (red curve) or EEA1, Syntaxin-6, and Syntaxin-13 knock-down (blue curve) or mock treatment (black curve). Cells were given a 1-min pulse of 100 ng/ml of EGF-AlexaFluor 555, washed and chased for the indicated time points before fixation. Curves were normalized to the intensity value at 10 min for mock-treated cells. Points show mean ± SEM. All measurements were done in three independent replicates with a total of ∼150 cells per time point or condition. Time courses were fitted as in Figure 1 (CD) Shift in the EGF-endosome area distribution after EEA1, Rabenosyn5, and Vps45 (C) or EEA1, Syntaxin-6, and Syntaxin-13 (D) knock-down measured as in Figure 3. Endosomes smaller than 0.2 μm2 (cross-sectional area) are increased after EEA1, Rabenosyn5, and Vps45 (C) or EEA1, Syntaxin-6, and Syntaxin-13 knock-down (D). Points show the mean ± SEM. All measurements were done in four independent replicates with a total of ∼200 cells per time point or condition. Experimental points were fitted with two lognormal distributions.

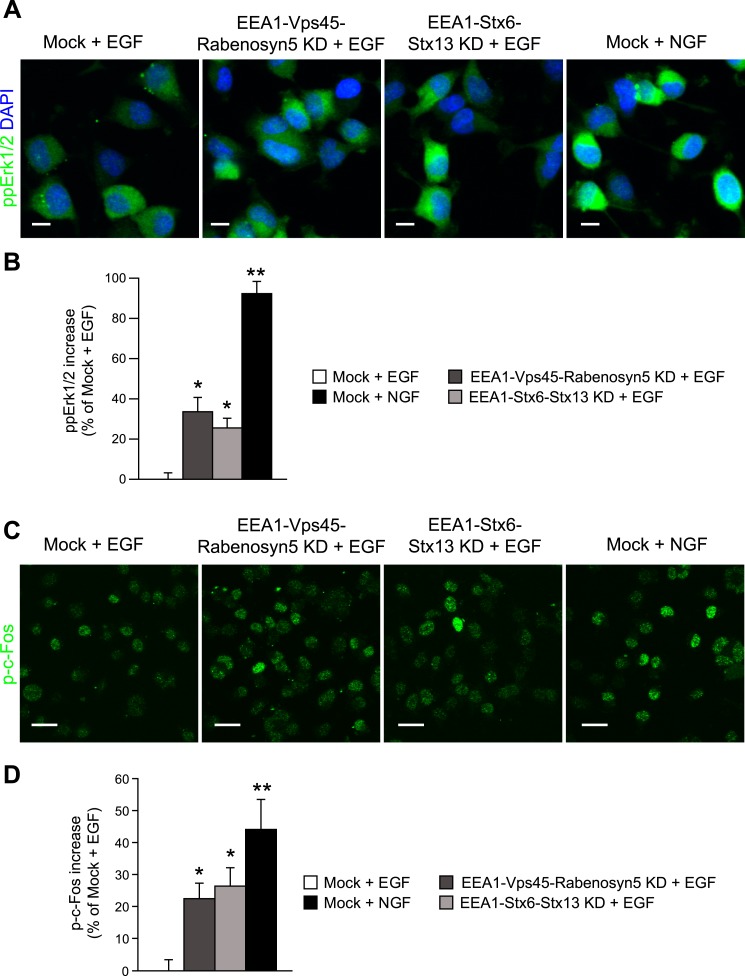
Figure 7—figure supplement 2. Redistribution of endosomal EGF is sufficient to increase MAPK activation in PC12 cells.

Figure 7—figure supplement 2.

(AD) Analysis of MAPK activation in PC12 cells after partial protein depletion of either EEA1, Rabenosyn5, and Vps45 or EEA1, Syntaxin-6, and Syntaxin-13, or mock treatment and stimulation with 100 ng/ml EGF or 50 ng/ml NGF for 30 min (A) Representative images of Erk1/2 activation by immunofluorescence in PC12 cells. phospho-Erk1/2 is shown in green and nuclei are shown in blue. Scale bars, 10 μm. (B) Increase in phospho-Erk1/2 intensity compared to EGF-treated control cells. The total intensity was normalized by the fraction of the area covered by cells. (C) Representative images of c-Fos phosphorylation by immunofluorescence in PC12 cells. phospho-c-Fos is shown in green. Scale bar, 25 μm. (D) Increase in nuclear phospho-c-Fos intensity compared to EGF-treated control cells. In all cases, data show mean ± SEM. For each parameter, pair-wise comparisons were done against EGF-stimulated mock-treated cells. *p < 0.05, **p < 0.005 by Fisher's LSD test. All measurements were done in three independent experiments with a total of ∼500 cells per condition.