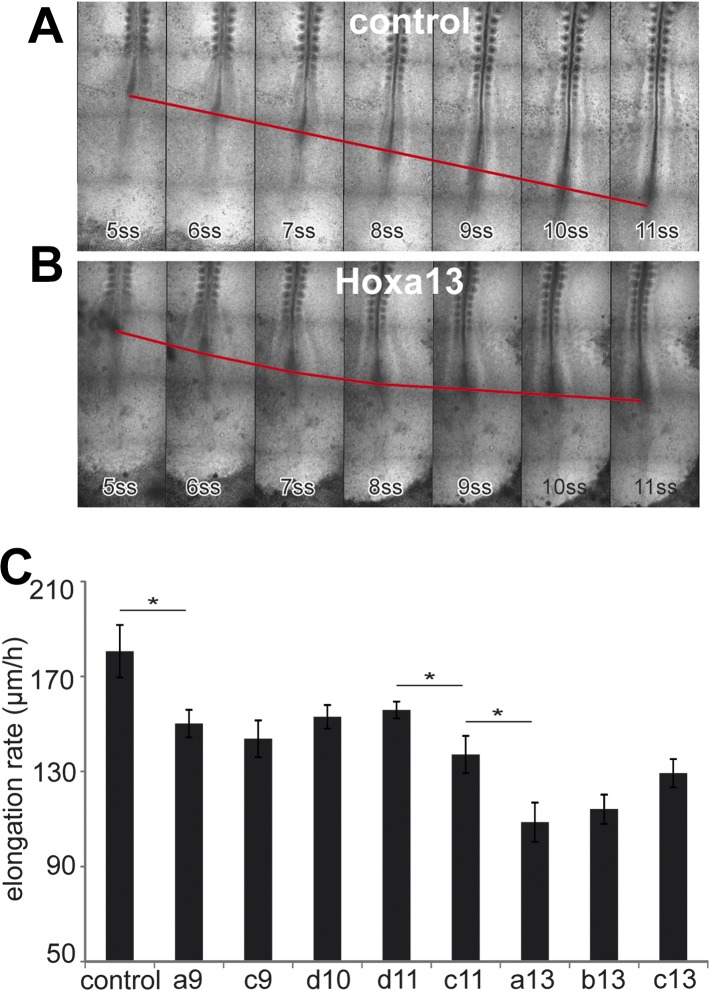
Figure 5. Posterior Hox genes control the axis elongation velocity in a collinear fashion.
(A–B) Time-lapse series of chicken embryos electroporated either with control (A) or Hoxa13 (B). Red line: position of Hensen's node. ss = somite-stage. (C) Velocity of axis elongation of embryos electroporated with either a control, Hoxa9, Hoxc9, Hoxd10, Hoxd11, Hoxc11, Hoxa13, Hoxb13, or Hoxc13 expressing constructs. Stars: p-value of two-tailed Student's t-test applied between the different conditions. *p < 0.05. Error bars: standard error to the mean (SEM).

