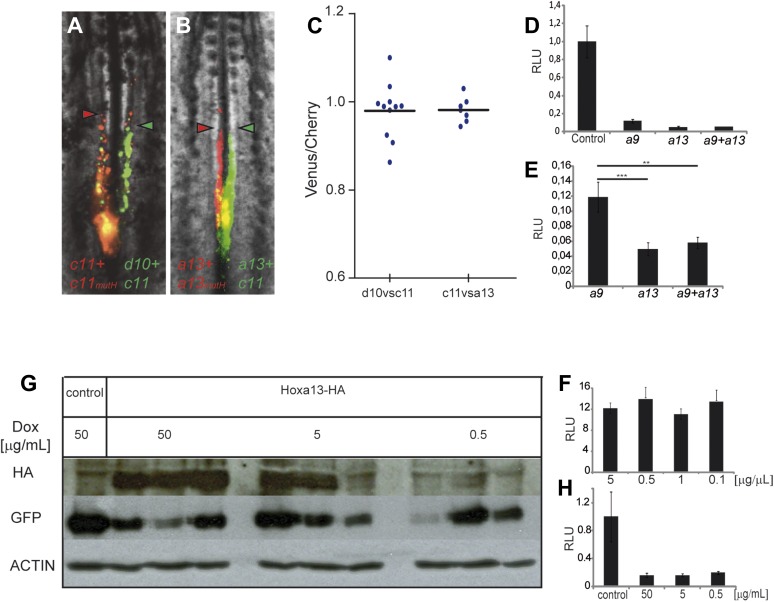
Figure 6. Posterior prevalence of posterior Hox genes.
(A) Embryos consecutively electroporated first with Hoxc11-Cherry + Hoxc11mutH-Cherry and with Hoxd10-Venus + Hoxc11-Venus shown 24 hr after reincubation. (B) Embryos consecutively electroporated first with Hoxa13-Cherry + Hoxa13mutH-Cherry and then with Hoxa13-Venus + Hoxc11-Venus shown 24 hr after reincubation. Red arrowheads: anterior boundary of Cherry-expressing cells. Green arrowheads: anterior boundary of Venus-expressing cells. (C) Quantification of the ratio of Venus over Cherry expressing domains for the experiments shown in A and B. Each dot corresponds to one electroporated embryo and bar indicates the mean. (D–E) Luciferase assay measuring Wnt/βcatenin pathway activity after over-expression of the BATLuc construct together with a Renilla-expressing vector and either (D) control, Hoxa9, Hoxa13 or the combination of Hoxa9 and Hoxa13 expressing vectors. (E) Blow-up of the samples shown in (D). (F) BATLuc assay with serial dilutions of the Hoxa13 plasmid (in μg/μl on the x axis). (G) Western blot labeled with an anti-HA antibody showing embryos electroporated with Hoxa13 under the control of a doxycycline-responsive promoter activated with different doses of doxycycline (in μg/ml). (H) BATLuc assay after Hoxa13 over-expression under the control of a doxycycline-responsive promoter activated with different doses of doxycycline (in μg/ml on the x axis). Stars represent the p value of the two-tailed Student's t-test applied between the different conditions. **p < 0.01; ***p < 0.005. Error bars represent the standard error to the mean (SEM).

