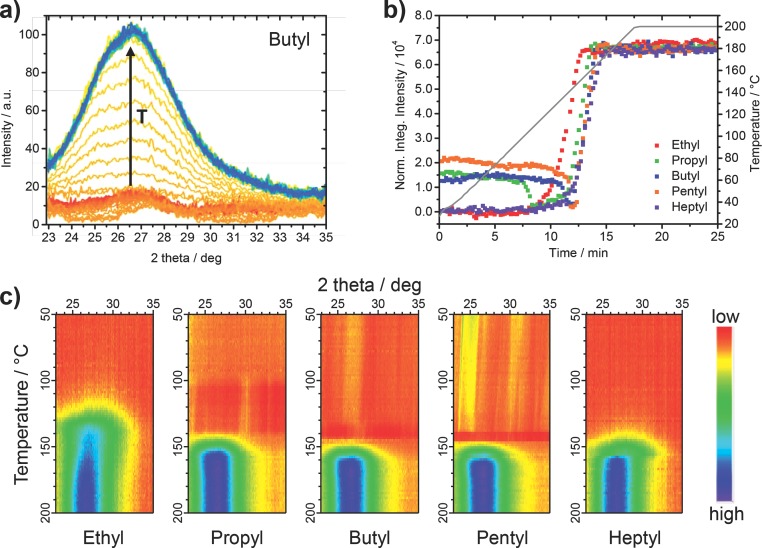
Figure 4.
a) GIWAXS patterns of a P3HT/Cd-butyl xanthate film measured between 22.9 and 35° 2 theta during a heating run from room temperature to 200 °C with a heating rate of 10 °C min−1 showing the evolution of the most intense peak of CdS at around 27° 2 theta. The increasing temperature (T) is indicated with a black arrow in the graph. b) Normalized integrated intensity of the GIWAXS patterns of the different P3HT/metal xanthate samples calculated between 22.9 and 35° 2 theta plotted versus reaction time and temperature. The corresponding GIWAXS patterns are shown in Figure S1 in the Supporting Information. c) Comparison of the temperature-dependent evolution of the most intense CdS peak during the heating run.

