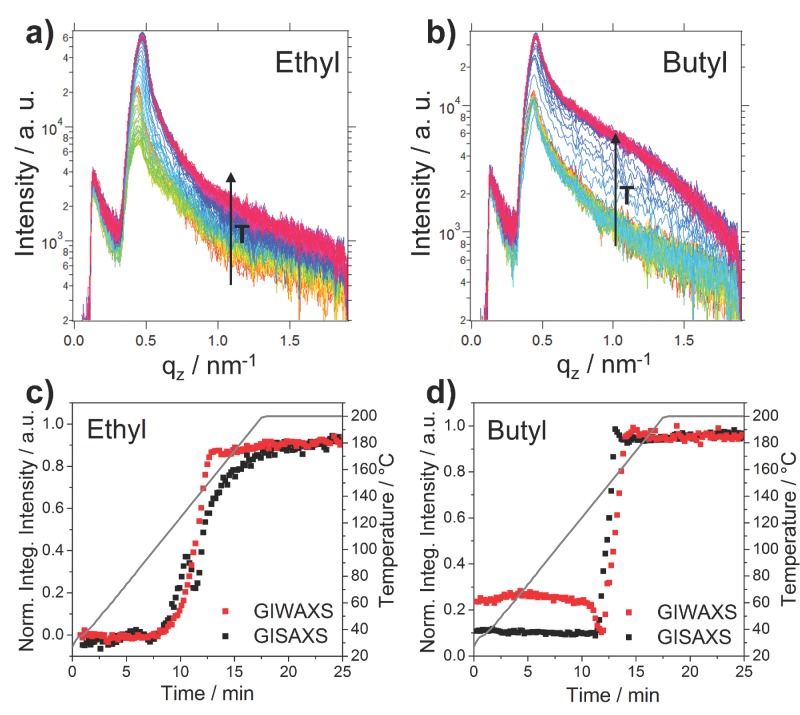
Figure 6.
Temperature-dependent evolution of the vertical cuts of the GISAXS patterns of a) the ethyl-sample and b) the butyl-sample. The increasing temperature (T) is indicated with a black arrow in the graphs. c, d) Comparison of the evolution of the integrated intensities of the GIWAXS and GISAXS signals during the heating run.

