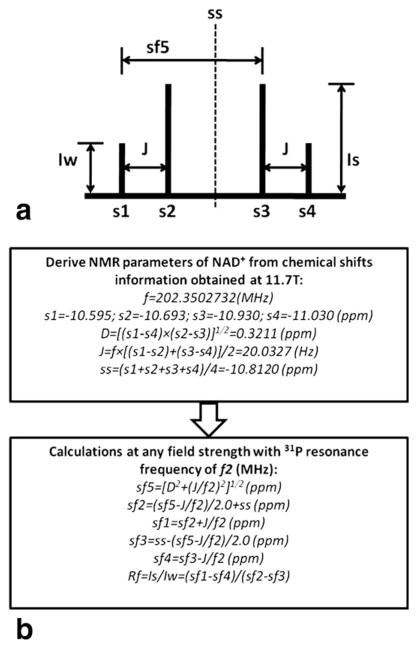
FIG. 1.
a: Diagram describes the NAD+ quartet with the two-spin system. b: The flow chart for spectrum prediction at any given field strength. The s1–s4 or sf1–sf4 represent the chemical shifts of NAD+ quartet at 11.7 T or any other field strength, respectively (set PCr at −2.5 ppm as reference); D is the true chemical shift separation of the NAD+ two-spin system; J is the coupling constant; ss is the center of the quartet; sf5 is the chemical shift difference between the first and third resonances at a given field strength; Rf represents the intensity ratio between the stronger peak (Is) and the weaker peak (Iw).

