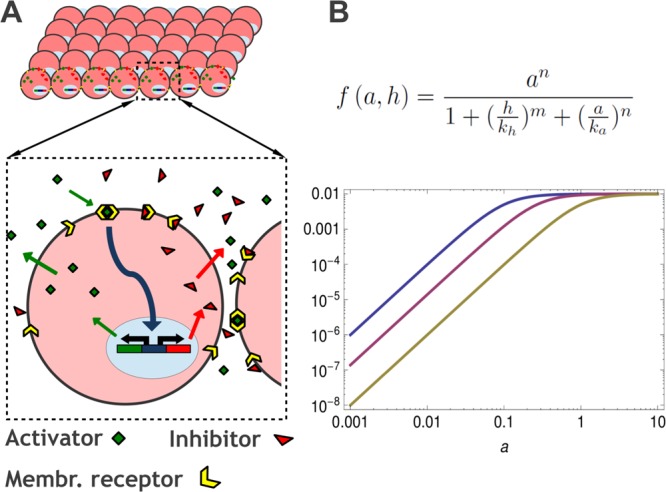
Figure 1.

Modeling overview. (A) Schematic diagram of the biological system at the cellular and molecular levels: activators (green particles; HGF) and inhibitors (red particles; NK4) are products of genes controlled by the same promoter (MMP-1). These molecules are released into the extracellular medium. Activator and inhibitor molecules compete for binding to membrane receptors (yellow; cMet). Activators bound to membrane receptors regulate the production of morphogens through the regulatory function f. (B) The regulatory function used in this article. The plots show f vs activator concentration a for three different concentrations of inhibitor h: 0.01 (blue), 0.25 (red), and 1.0 (brown). nH = 2, ka = kh = 0.1.
