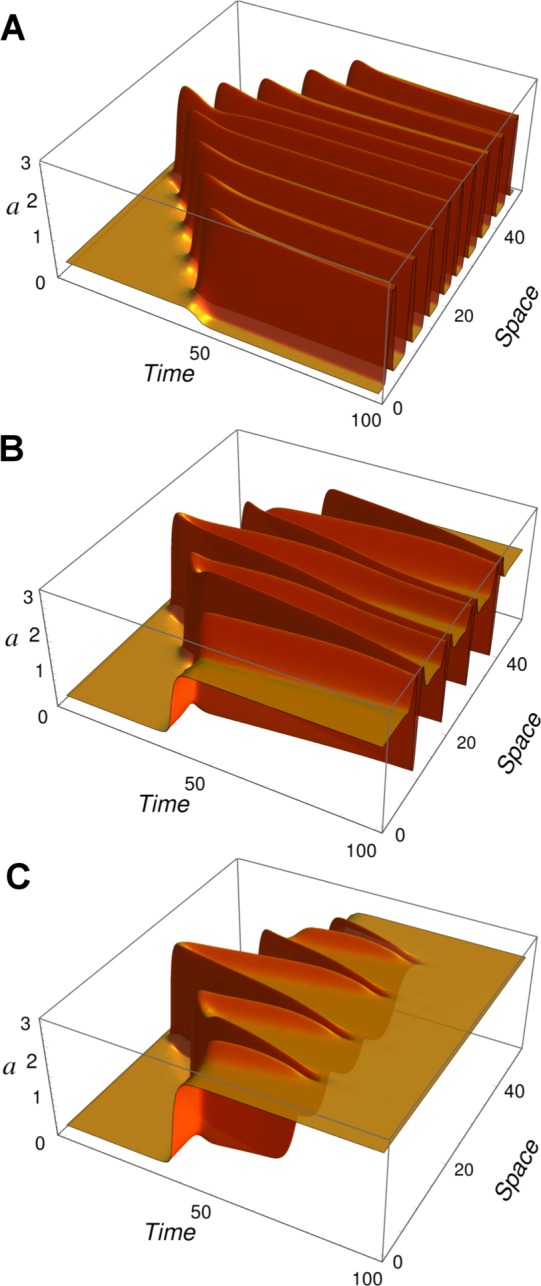
Figure 4.

Turing patterns and morphogen degradation. Striped patterns obtained by numerical integration of eqs 5 and 6, using the same parameters as Figure 3B (white dots), for three different values of μ: 0.45 (A), 1.0 (B) and 1.5 (C). In all cases, the initial condition is a small Gaussian perturbation of the unstable steady state at x = 25. In agreement with Figure 3B, the size of the pattern in the simulation increases with μ. Because μ is the ratio of the degradation rates of inhibitor relative to activator, increasing inhibitor degradation or decreasing activator degradation will increase the pattern size. For μ = 1.5 (C), the typical Turing pattern decays to the stable solution after its initial formation, at t = 75, as a consequence of a field size effect.
