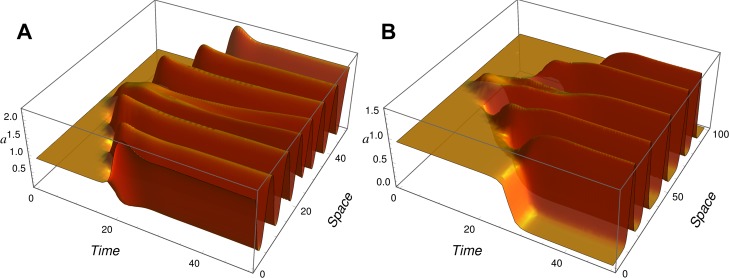
Figure 8.

Patterns with low differential diffusion D by using higher Hill coefficients: simulation results obtained for D = 0.5, nH = 5, μ = 0.7, rh = 5.5, and ra = 6 (A) and for D = 0.75, nH = 6, μ = 0.8, rh = 6, and ra = 6 (B). The D term reflects the ratio of the diffusion constants of activator/inhibitor, and patterns can be achieved with relatively small differences so long as the response function is steep, i.e., cooperative. Note that different spatial scales are used.
