
Figure 4.
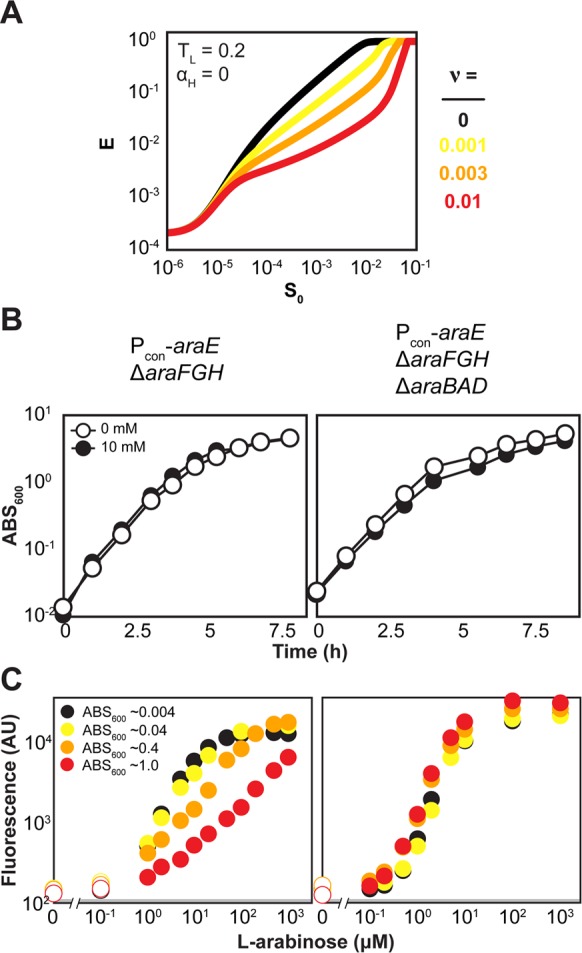
Effect of cell density in the presence or absence of sugar catabolism. (A) Model predictions for the pathway with a constitutively expressed low-affinity transporter (TL = 0.2) and the deleted high-affinity transporter (αH = 0) when accounting for depletion of extracellular sugar through catabolism. Each simulation was conducted to τ = 10. The different curves reflect the relative volume of the cells to the medium (ν). Note that all variables were nondimensionalized as part of the model derivation. See Supporting Information for more details. (B) Growth curves for the Pcon-araE ΔaraFGH strain with or without (ΔaraBAD) sugar catabolism in defined medium with or without 10 mM l-arabinose. Each value represents the mean of three independent experiments. The SEM for each measurement was smaller than the symbol. (C) Representative dot plots for both strains in log phase grown to the indicated final cell densities. See Figure 3 for more information on the dot plots. Each dot plot is representative of at least three experiments conducted from independent colonies. See Table 1 for the response metrics that account for the replicate experiments.