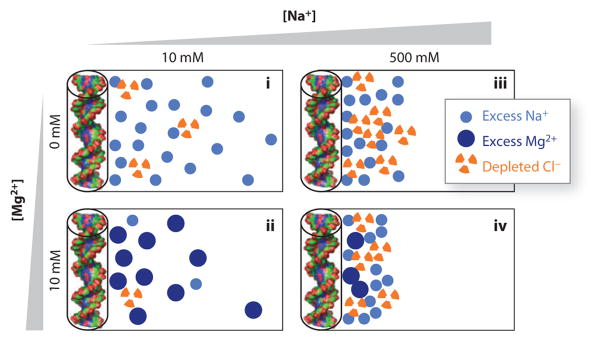
Figure 5.

Schematic of the ion atmosphere surrounding nucleic acids under different solution conditions. The circles represent excess counterions and depleted coions in the ion atmosphere, respectively, compared with a buffer-only sample. The number of accumulated and depleted ions shown schematically corresponds (approximately) to the results of buffer equilibration–atomic emission spectroscopy ion counting measurements for 24-bp DNA duplexes (represented by cylinders and molecular renderings on the left of each panel) (51), with each symbol representing two ions. The schematically rendered ion atmospheres depict several experimentally observed trends: (i) Higher total ionic concentration increases coion depletion compared to counterion accumulation, which is partly due to excluded volume effects (see Reference 196 for details); (ii) an atmosphere predominantly of divalent cations leads to a tighter spatial association of the ions around the nucleic acid; (iii) at approximately equal concentrations of mono- and divalent ions, the ion atmosphere is dominated by divalent ions; and (iv) even in a large excess of monovalent ions, some divalent ions are expected to remain close to the nucleic acid.
