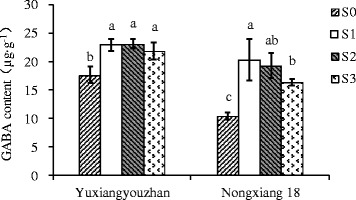
Figure 2.

Effect of shading treatment on grain GABA content in grains. Vertical bars with different lower case letters above are significantly different at P = 0.05 by LSD tests. Capped bars represent SD.

Effect of shading treatment on grain GABA content in grains. Vertical bars with different lower case letters above are significantly different at P = 0.05 by LSD tests. Capped bars represent SD.