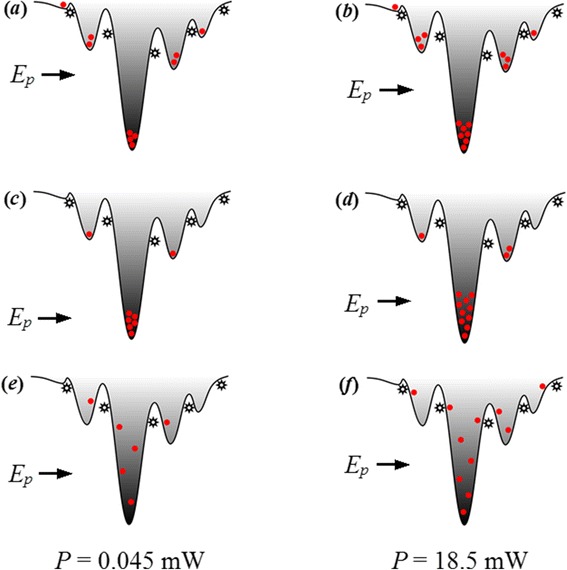
Figure 5.

Schematic diagrams indicating the possible mechanism of the S-shaped temperature dependent PL peak energy, linewidth evolution, and anomalous emission enhancement. The carrier distributions at lowest T (5 K), temperature that starts to blueshift (60/100 K) and room temperature are shown in ( a ), ( c ), ( e ) and ( b ), ( d ), ( f ) for P = 0.045 and 18.5 mW, respectively.
