Figure 6.

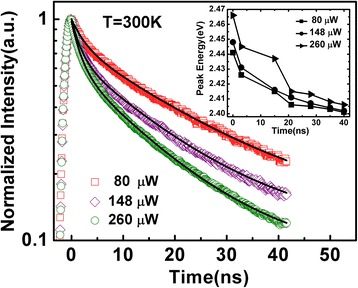
TRPL decay curves of the QDs at different excitation power. The solid curves are biexponential fits to experiment data. The inset shows temporal variation of the peak energy of the PL spectra.

TRPL decay curves of the QDs at different excitation power. The solid curves are biexponential fits to experiment data. The inset shows temporal variation of the peak energy of the PL spectra.