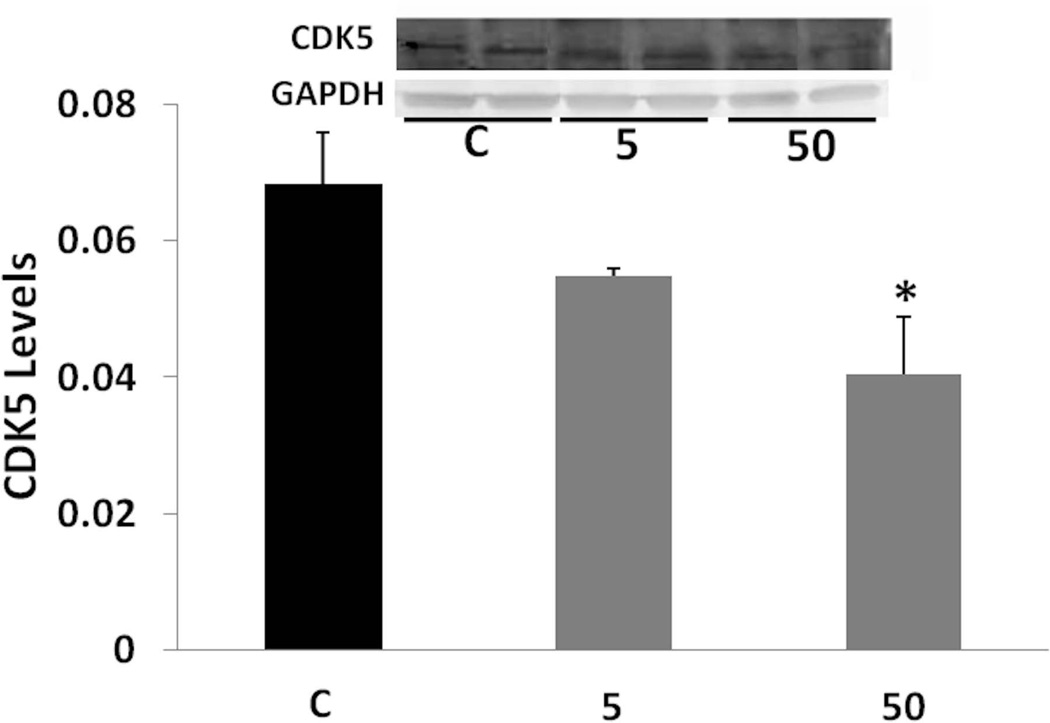
Fig. 5. CDK5 levels following tolfenamic acid treatment.
CDK5 levels in cerebral cortices of mice administered tolfenamic acid or control for 34 days were obtained by Western blot analysis. CDK5 levels were normalized to GAPDH levels. Values shown are for the mean ± SEM, n=4. One-way ANOVA p=0.059. *p < 0.05 according to Tukey-Kramer post-test. Insert shows representative control (C), 5 or 50 mg/kg treatment CDK5 or GAPDH Western blot bands.

