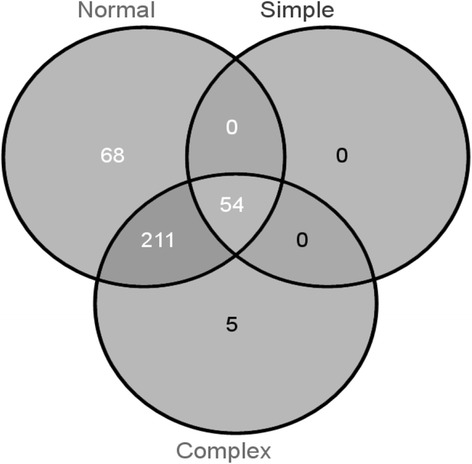
Figure 4.

Venn diagram showing numbers of different CREs present in each group (complex, simple and normal regulation). Complex regulation was considered when the CRE occurrence was greater than or equal to the average of occurrences in all up-regulated genes plus two standard deviations. The group of simple regulation was considered when the CRE occurrences was smaller than or equal to the average of occurrences in all up- regulated genes minus two standard deviations. CREs that occurs in the gene promoter in the interval between complex and simple regulation are considered to have normal regulation.
