Figure 4.

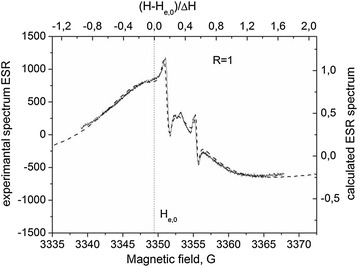
Theoretical description of the experimental spectrum (Figure 3 , curve 2). The dotted line indicates the position H res for conduction electrons.

Theoretical description of the experimental spectrum (Figure 3 , curve 2). The dotted line indicates the position H res for conduction electrons.