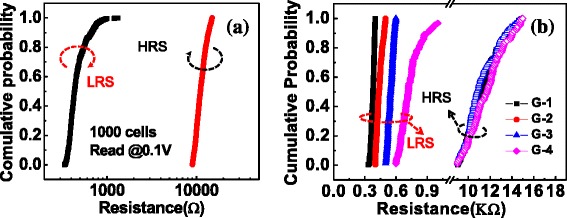
Figure 3.

The global statistical distribution of R LRS and R HRS . (a) R LRS is distributed in a range of 300 to 1,000 Ω, whereas R HRS concentrates around 10 kΩ approximately. (b) R LRS was divided into four different groups. The open-symbol lines: R HRS distribution for four-group R LRS.
