Figure 5.

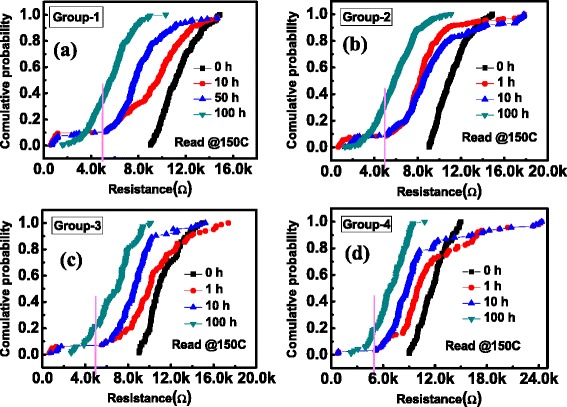
Cumulative distributions. Cumulative distributions of R HRS for (a) G-1, (b) G-2, (c) G-3, and (d) G-4 as the baking time increasing at an annealing temperature T = 150°C.

Cumulative distributions. Cumulative distributions of R HRS for (a) G-1, (b) G-2, (c) G-3, and (d) G-4 as the baking time increasing at an annealing temperature T = 150°C.