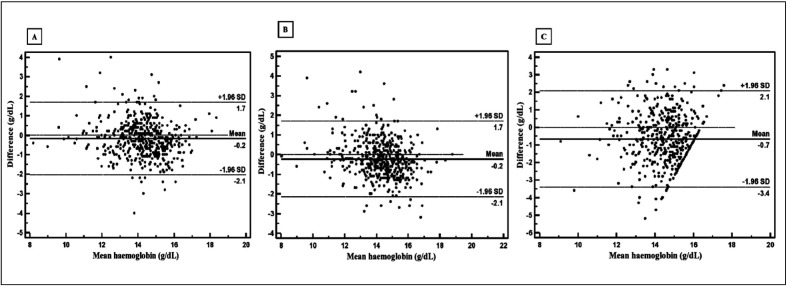
Figure 1.
Bland-Altman plot showing concordance of the tested methods with the reference method.
Panels A, B and C present results for DiaSpect, Hemocontrol and NBM-200, respectively. Each dot represents the mean of difference in Hb values between the reference method and the test method with the x-axis showing the Hb values of donors measured with the reference method and y-axis showing the variation of the mean difference in Hb with standard deviation. The two extreme lines mark two standard deviations from the central line at level 0. The line adjacent to the 0 line represents the mean of difference in Hb values. Hb: haemoglobin.

