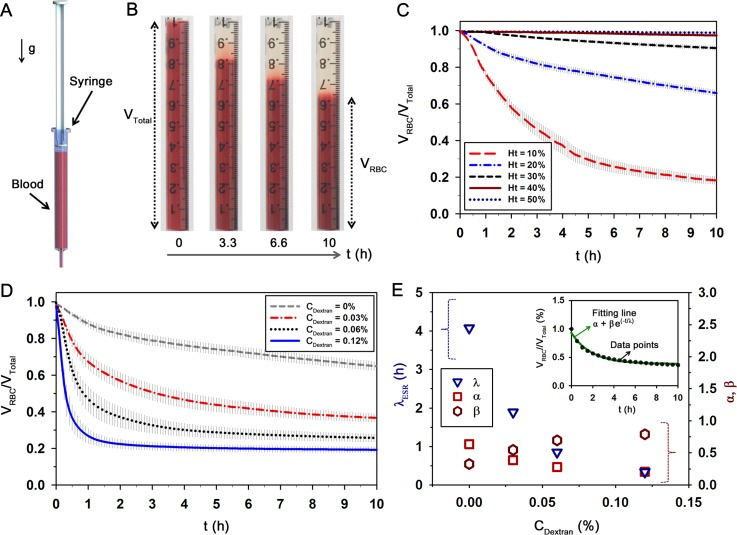
FIG. 3.
Modified ESR method to measure erythrocyte aggregation. (a) Schematic diagram of the ESR measurement method. After loading a blood sample in the disposable syringe (1 ml), the syringe is vertically disposed at an inverted position. (b) Typical images showing the sedimentation of RBCs in a blood sample with a total volume of VTotal = 1 ml with respect to time (t). The volume of the sedimented RBCs (VRBC) is gradually decreased with the lapse of time. Temporal variations of VRBC/VTotal with respect to (c) hematocrit (Ht) and (d) dextran concentration (CDextran) at Ht = 20%. (e) Quantitative evaluations of λESR, α, and β according to CDextran. Data points (CDextran = 0.03%) and a fitting curve determined by Eq. (5) are included in the inset. Each data set indicates the mean value and standard deviation evaluated from three test samples.

