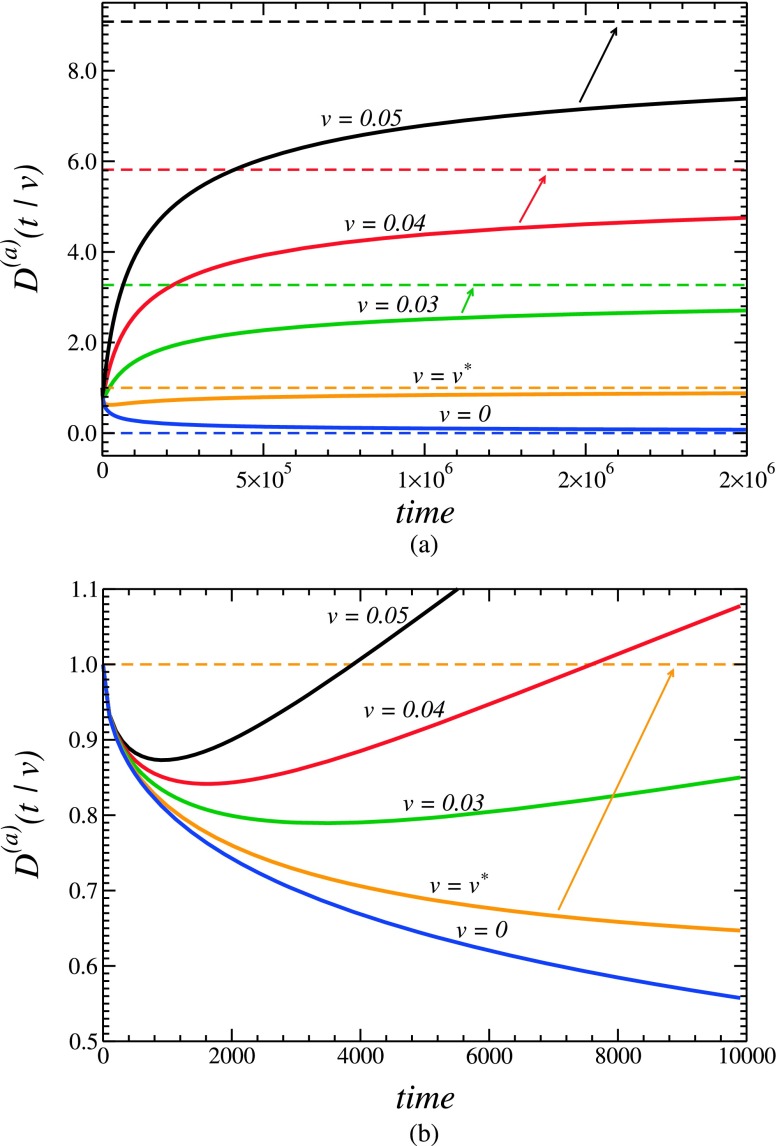
FIG. 5.
Transient behavior of the effective diffusivity, D(a)(t|v), in the anomalous regime. The curves shown in this figure are analogous to those shown in Fig. 4. The difference between the curves shown in the two figures is in the expressions for the Laplace transform of the mean cumulative time , which are used to draw the curves. While the curves in Fig. 4 are drawn using in Eq. (4.6), here the curves are drawn using in Eq. (4.7).

