
Figure 2.
Affymetrix CytoScan Results
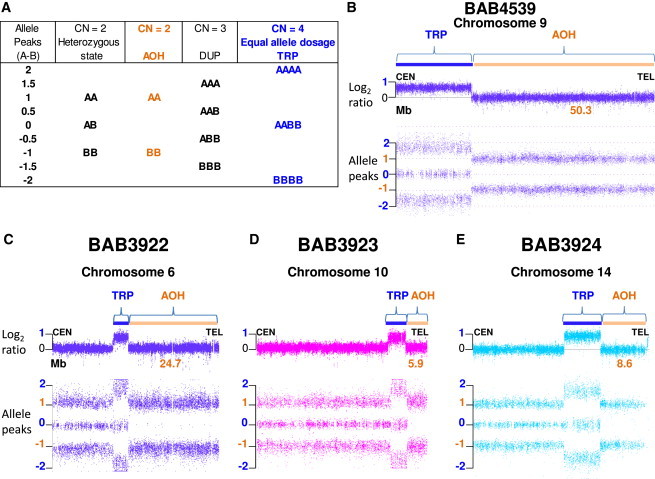
(A) Chromosome Analysis Suite (ChAS) software compares SNP probe intensities from index individual sample DNA with those of a sex-matched pooled reference DNA sample to calculate log2 ratios and infer copy number state (CN) that differ from the expected 0 value for CN = 2. Genotype calls and allele dosage normalization are performed as follows: the basic formula for allele peaks is A − B, where A is the signal of the A allele and B is the signal of the B allele. The allele peaks are normalized such that AA = 1.0, AB = 0.0, and BB = −1.0. Table shows allele dosage that differs from the heterozygous, diploid state.
(B–E) ChAS graphic results for chromosomes that presented triplication (TRP, blue rectangle) and absence of heterozygosity (AOH, orange rectangle) in subjects (B) BAB4539, (C) BAB3922, (D) BAB3923, and (E) BAB3924. Top, copy number log2 ratio; bottom, allele peaks (A − B). Alteration size is shown in Mb.