
Figure 4.
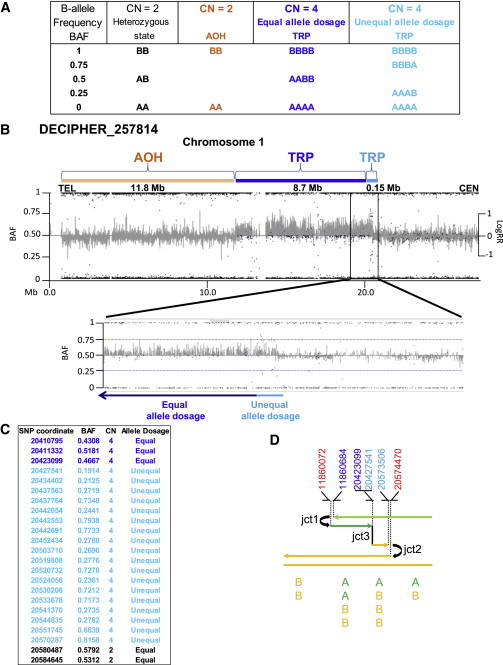
Subject DECIPHER_257814 Presents a Third Breakpoint Junction
Analysis of the Illumina SNP array revealed a triplicated segment with unequal allele dosage indicating dissimilar genotype inheritance (unequal allele dosage, light blue) followed by a region containing similar genotype inheritance (equal allele dosage, dark blue).
(A) Table shows some of the possible genotype calls performed by the allele dosage normalization Illumina’s platform algorithm. B-allele frequency (BAF) formula is calculated as: B / (A + B), where A is the signal of the A allele and B is the signal of the B allele. In BAFs, both AA and hemizygous A display as 0.0, AB displays as 0.5, and both B and hemizygous B display as 1.0.
(B) Graphic view of telomeric 20 Mb spanning 1p showing BAF and LogRR for subject DECIPHER_257814 indicating an 11.8 Mb region of absence of heterozygosity (AOH, orange rectangle) and triplication (TRP, dark and light blue rectangles). BAF data revealed that the centromeric TRP breakpoint segment of 148.5 kb (enlarged detailed view) presents with unequal allele dosage (light blue) of the parental alleles that is followed by a TRP segment with equal allele dosage (8.7 Mb, dark blue). LogRR indicates Log R ratio used to calculate copy number state that differ from the expected 0 value for CN = 2.
(C) Informative Illumina SNP BAF data spanning the region containing jct3 (triplication with an equal parental allele dosage to triplication with an unequal parental allele dosage) and jct2.
(D) Color-matched schematic representation of the 1p36.12 CGR formation. DECIPHER_257814 is hypothesized to present at least three breakpoint junctions generated by template switches during replication-based repair (refer to model described in Figure 1). Top: genomic coordinates (hg19) of breakpoint junctions in chromosome 1 inferred from multiple technical approaches. For sequencing data at jct1 and jct2, refer to Figure S4. Red indicates duplicated segment; light blue indicates triplicated segment harboring unequal allele dosage; dark blue indicates triplicated segment harboring equal allele dosage. Bottom: representation of the SNP allele dosage in each segment involved in this CGR. A, B: SNP alleles. Note that the different orientation of the rearrangement in DECIPHER_257814 compared to that shown in Figure 1, in this case involving the p-arm.