
Figure 2.
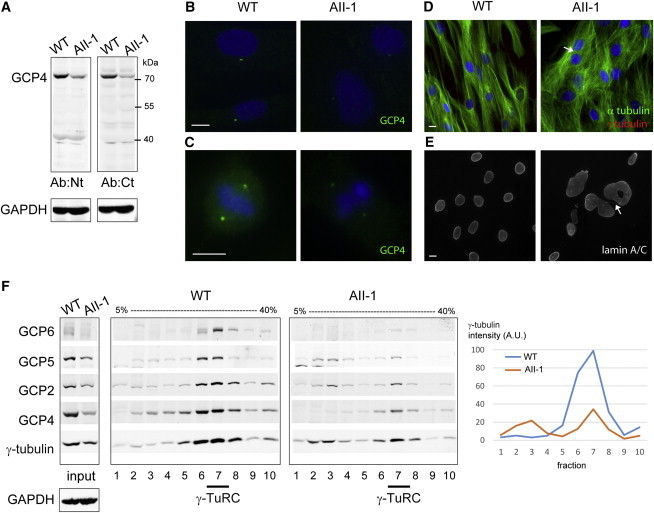
Fibroblasts from Individual AII-1 Have Reduced Amounts of GCP4 and γ-TuRCs and Show Aneuploidy
(A) Immunoblot shows lower GCP4 levels in the fibroblasts from individual AII-1 than in control fibroblasts. Antibodies against the N-terminal domain (Ab:Nt) or a C-terminal peptide (Ab:Ct) of GCP4 were used. GAPDH was used as a loading control.
(B and C) Immunofluorescence of GCP4 (green) shows lower levels in AII-1 fibroblasts than in control fibroblasts in interphase (B) and mitosis (C).
(D) Immunofluorescence of microtubules (green) and γ-tubulin (red) shows abnormal microtubule organization and altered cell morphology in AII-1 fibroblasts. The arrow points to a binucleated cell.
(E) Immunofluorescence of lamin A/C shows nuclear defects in AII-1 fibroblasts: large nuclei, abnormal shapes, and multiple nuclei, connected by chromatin bridges (arrow), per cell.
(F) Immunoblots of extracts from control and AII-1 fibroblasts before (input) or after fractionation in gradients of 5%–40% sucrose. Antibodies against γ-tubulin and GCP2, GCP4, GCP5, and GCP6 were used for visualizing γ-TuRC components. The peak position of the γ-TuRC (fraction 7) is indicated below the figure. On the right, the quantification of γ-tubulin signal intensity shows a 63% reduction of the γ-TuRC in fraction 7 from AII-1 fibroblasts.
DNA is blue in merged images. Scale bars represent 10 μm. Antibodies are anti-GCP4 Ab:Nt (R7629/30), Ab:Ct (R801),13 anti-GCP2,12 anti-γ-tubulin TU-30 (Abcam), anti-GCP5 E-1 (Santa Cruz biotech.), anti-GCP6 (Abcam), anti-α-tubulin (Sigma), and anti-lamin A/C (Santa Cruz Biotech).