
Figure 5.
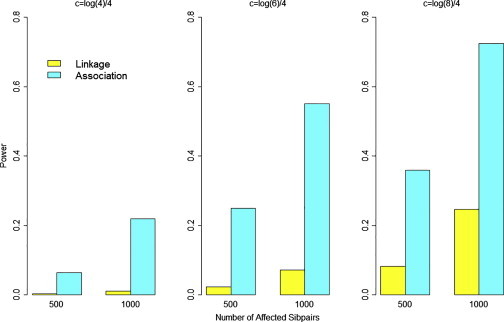
Power to Detect Linkage and Power to Detect Association in Affected Sib Pairs under Different Sampling Designs Assuming 500 or 1,000 Affected Sib Pairs
Yellow bar denotes power to detect linkage at genome-wide significance threshold of 10−5. Magenta bar denotes power to detect association using YBurden at genome-wide threshold of 2.5 × 10⁻⁶. Results shown for c = log(4)/4 (left), c = log(6)/4 (middle), and c = log(8)/4 (right). Each set of results based on 1,000 replications assuming λC = 4 and 15% of rare variants are causal with 100% of causal variants increasing risk.