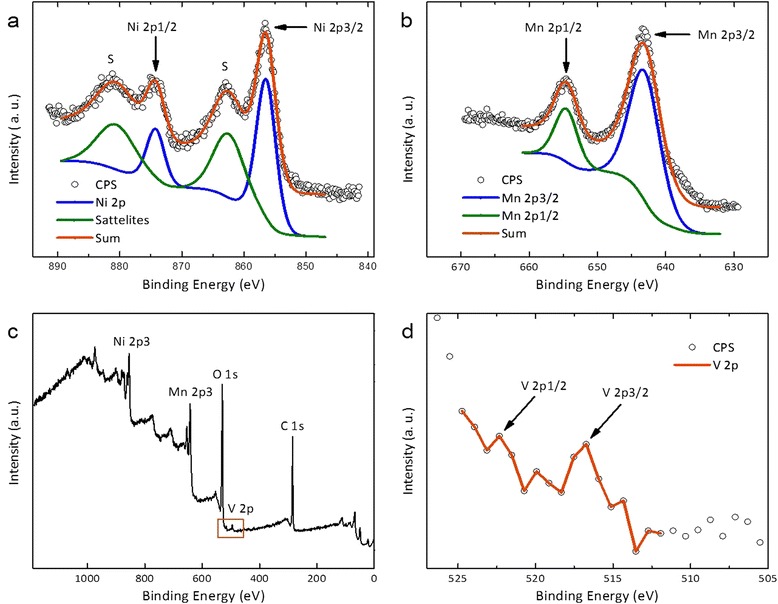
Figure 4.

XPS-spectra of V 2 O 5 (5%) -NiMnO. (a) Ni 2p spectrum. Blue: Fit for Ni 2p3/2- and 2p1/2-peak. Yellow: Fit for the two satellite peaks. Red: Envelope of both fits. (b) Mn 2p spectrum. Blue: Fit for Mn 2p3/2-peak. Yellow: Fit for Mn 2p1/2-peak. Red: Envelope of both fits. All fits were shifted to lower intensity for better visibility. (c) Spectrum over whole binding energy range. Ni, Mn, V, C, and O are marked at the highest intensity peaks. (d) Magnification of V 2p peak as marked in (c) showing the position of the 2p1/2- and 2p3/2-peak.
