
Figure 9.
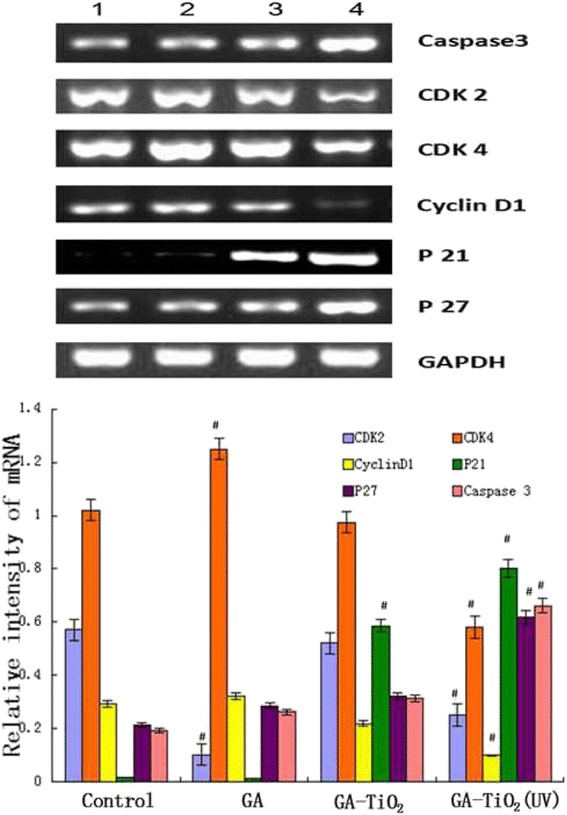
mRNA expression of apoptosis-associated genes by RQRT-PCR. K562 cells were treated with different reagents for 24 h. Notes: data were normalized to K562 cell blank group. (1) K562 cells were incubated with same volume of saline; (2) K562 cells were treated with GA; (3) K562 cells were incubated with GA-TiO2 nanocomposites; (4) K562 cells were incubated with GA-TiO2 nanocomposites with UV irradiation; data were figured as mean ± SD. # P < 0.05 when compared with the control group.