Figure 3.

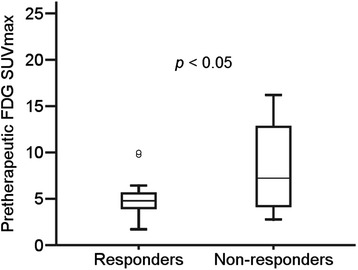
Comparison of pretherapeutic FDG SUVmax between responders and non-responders. The median value and the interquartile range are represented by box plot.

Comparison of pretherapeutic FDG SUVmax between responders and non-responders. The median value and the interquartile range are represented by box plot.