
Figure 6.
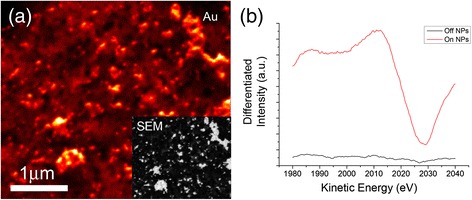
Scanning auger microscopy analysis of printed AuNPs on carbon electrode. (a) Scanning auger microscopy image of AuNPs using peak intensity from the centre of the Au peak (inset shows SEM image of corresponding area). (b) Differentiated spectra taken from areas on the AuNPs (red) and off of the AuNPs (black).