
Figure 7.
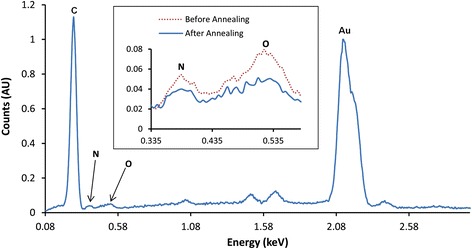
EDX spectrum of printed AuNPs at carbon electrode before and after annealing. Energy dispersive X-ray analysis of the AuNPs printed onto a carbon electrode shows carbon, gold, nitrogen and oxygen. The inset shows nitrogen and oxygen peaks before (red) and after (blue) annealing, indicating a reduction in nitrogen and oxygen peaks due to the annealing process.