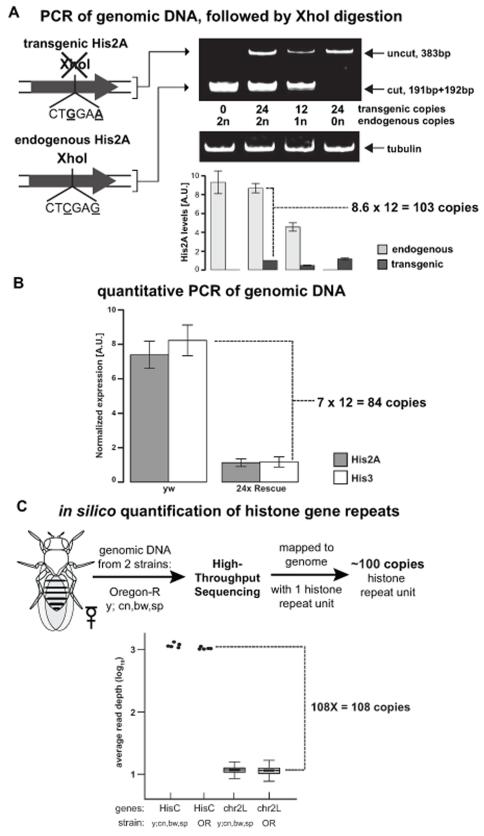
Figure 2. The haploid Drosophila genome contains 100 copies of the histone repeat unit.
(A) Ethidium bromide-stained gel of XhoI-digested PCR products of endogenous and transgenic His2A genes. For each of the four genotypes, barplots of normalized band intensity are shown below each lane. Error bars represent standard error of the mean (SEM). (B) Barplots of normalized real-time PCR results for wild type (yw) and 24× Rescue genotypes using primers to His2A and His3. Error bars: SEM. (C) Flow chart and plots of in silico quantification of histone gene repeats for two wild type strains (Oregon R (OR), and y;cn,bw,sp). HisC: total read depth for each of the five replication-dependent genes; chr2L: box plots of average read depth for the remaining genes on chromosome 2L. The box represents the inner quartile range (IQR), and whiskers represent 1.5-times IQR. For clarity, outliers were not plotted.

