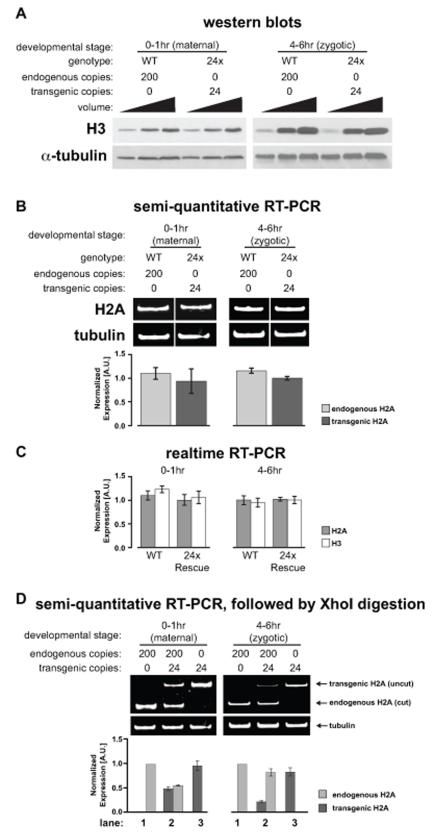
Figure 3. Transgenic histone arrays are expressed at levels similar to the endogenous genes.
(A) Western blot of wild type (WT) and 24× Rescue genotypes at 0-1hr and 4-6hrs after egg laying. (B) Ethidium bromide stained gel of RT-PCR products from 0-1hr and 4-6hr wild type (WT) and 24× Rescue embryos. Barplots of normalized band intensity are shown below each lane. Error bars: SEM. (C) Barplots of normalized real-time RT-PCR results for H2A and H3 in 0-1hr and 4-6hr wild type (WT) and 24× Rescue embryos. Error bars: SEM. (D) Ethidium bromide stained gel of XhoI-digested RT-PCR products from 0-1hr and 4-6hr embryos for three genotypes: wild type (lane 1); +/+;12×WT/12×WT (lane 2); 24× Rescue (lane 3). Barplots of normalized band intensity are shown. Error bars: SEM. See also Figure S2.

