Figure 1.

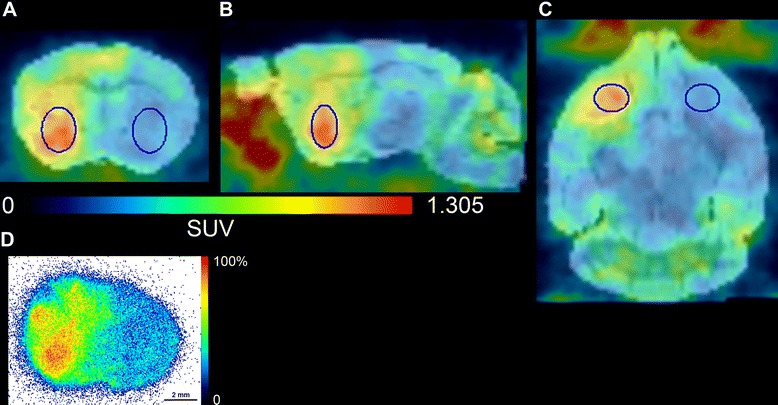
In vivo SPECT imaging, histology and ex vivo autoradiography. In vivo SPECT image (summed frames between 50 and 80 min of scan), co-registered with a mouse brain MRI template, obtained from one mouse bearing the GL26 tumor in the coronal (A), sagittal (B), and axial (C) planes. VOIs corresponding to tumor and contralateral brain tissue are also depicted. (D) Ex vivo autoradiography of a corresponding brain section from the same mouse. Color scale refers to percentage of maximal activity in the image.
