Fig. 4.

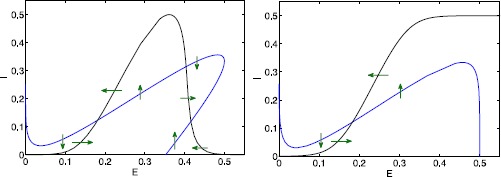
Phase planes for Gaussian (left) and sigmoid (right) activation function. Excitatory (blue) and inhibitory (black) nullclines and directions are shown for parameters as in Sect. 2 with and . Note the additional steady states for the Gaussian

Phase planes for Gaussian (left) and sigmoid (right) activation function. Excitatory (blue) and inhibitory (black) nullclines and directions are shown for parameters as in Sect. 2 with and . Note the additional steady states for the Gaussian