
Figure 4.
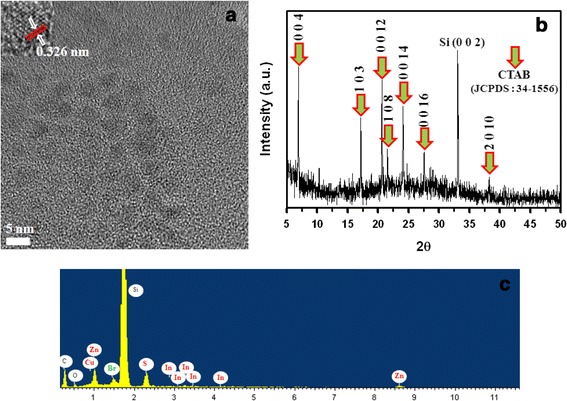
Structural analysis of CTAB-CIS/ZnS NCs. (a) High-resolution TEM image of CTAB-CIS/ZnS NCs. (b) X-ray diffraction pattern of CTAB-CIS/ZnS NCs. (c) EDX spectrum of the CTAB-CIS/ZnS NCs.
Official websites use .gov
A
.gov website belongs to an official
government organization in the United States.
Secure .gov websites use HTTPS
A lock (
) or https:// means you've safely
connected to the .gov website. Share sensitive
information only on official, secure websites.
Structural analysis of CTAB-CIS/ZnS NCs. (a) High-resolution TEM image of CTAB-CIS/ZnS NCs. (b) X-ray diffraction pattern of CTAB-CIS/ZnS NCs. (c) EDX spectrum of the CTAB-CIS/ZnS NCs.