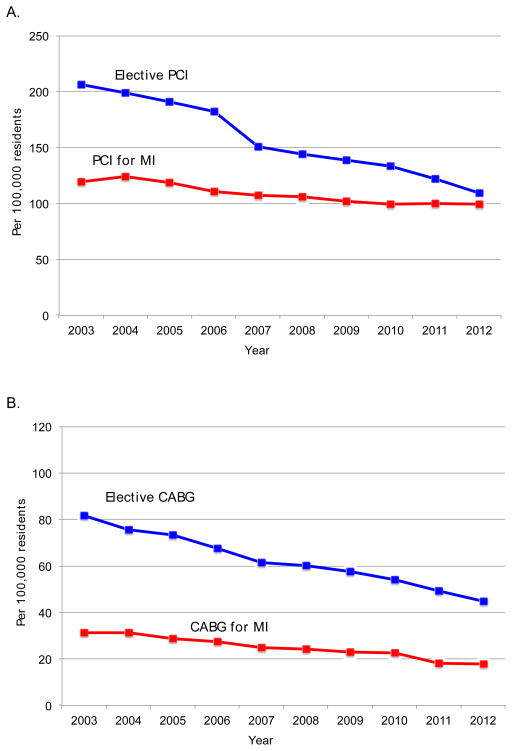
Figure 2.
Temporal trends in rates of A) percutaneous coronary intervention and B) coronary artery bypass graft surgery, stratified by presentation with or without myocardial infarction, 2003 – 2012.
Temporal trends in rates of percutaneous coronary intervention (Panel A) and coronary artery bypass graft surgery (Panel B), stratified by presentation with or without myocardial infarction. Rates reflect the number of unique individuals with and without myocardial infarction undergoing percutaneous coronary intervention in a given year, per 100,000 residents, and are adjusted for age and sex. PCI, percutaneous coronary intervention. MI, myocardial infarction.

