Fig. 2A–B.

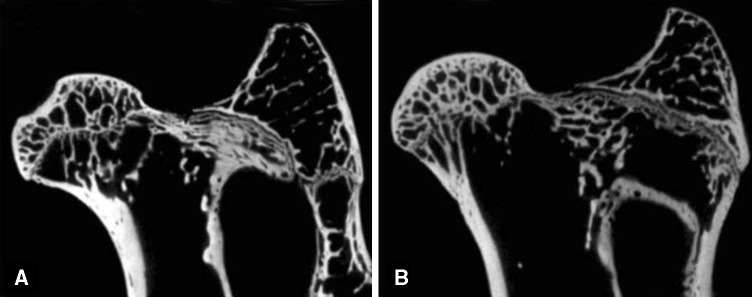
(A) A representative micro-CT image from the control group showed that the trabecular bone was more sparse in the subchondral bone. (B) In the LIPUS group, the trabecular bone was thicker and denser.

(A) A representative micro-CT image from the control group showed that the trabecular bone was more sparse in the subchondral bone. (B) In the LIPUS group, the trabecular bone was thicker and denser.