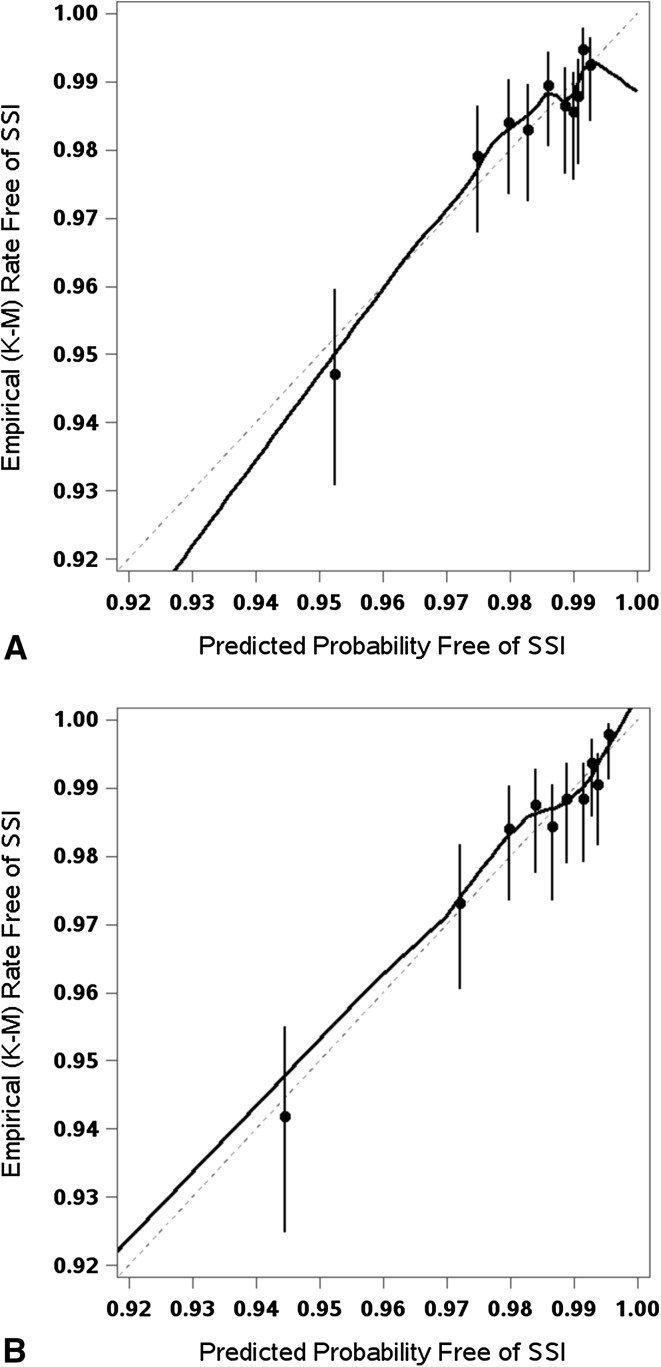
Fig. 3A–B.
The calibration plots show the observed versus predicted probability of surgical site infections (SSI) for THAs using the (A) claims-based model and (B) the claims + clinical risk factors model. The dots represent Kaplan-Meier (K-M) survival estimates with the vertical bars showing the respective 95% CIs.

