Figure 1.

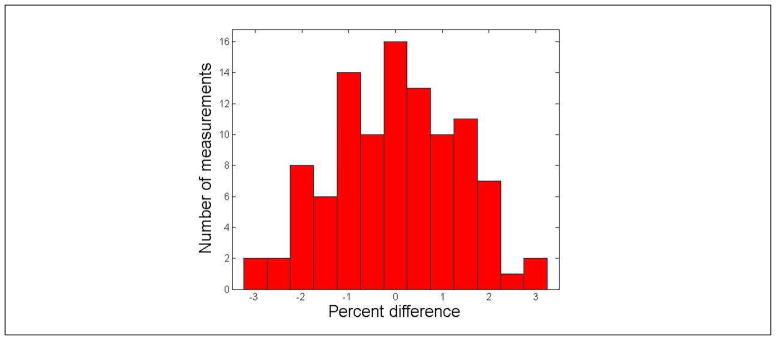
Histogram of the difference between the ionization chamber measured and TPS calculated point doses. The mean difference was 0.0% ± 1.3% (1 standard deviation, n=102), ranging from −3.0% to 2.9%.

Histogram of the difference between the ionization chamber measured and TPS calculated point doses. The mean difference was 0.0% ± 1.3% (1 standard deviation, n=102), ranging from −3.0% to 2.9%.