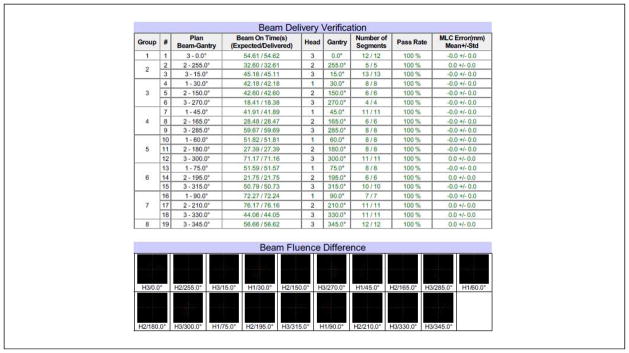
Figure 4.

Typical results for machine delivery log file QA. The tolerance was set to 0.5 degrees for gantry, 2 mm for MLC leaf positioning, and 0.2 sec for beam-on time. The 2D fluence passing rate was defined as the percentage of the pixels with delivery errors less than 2% of the maximum fluence in the field.
