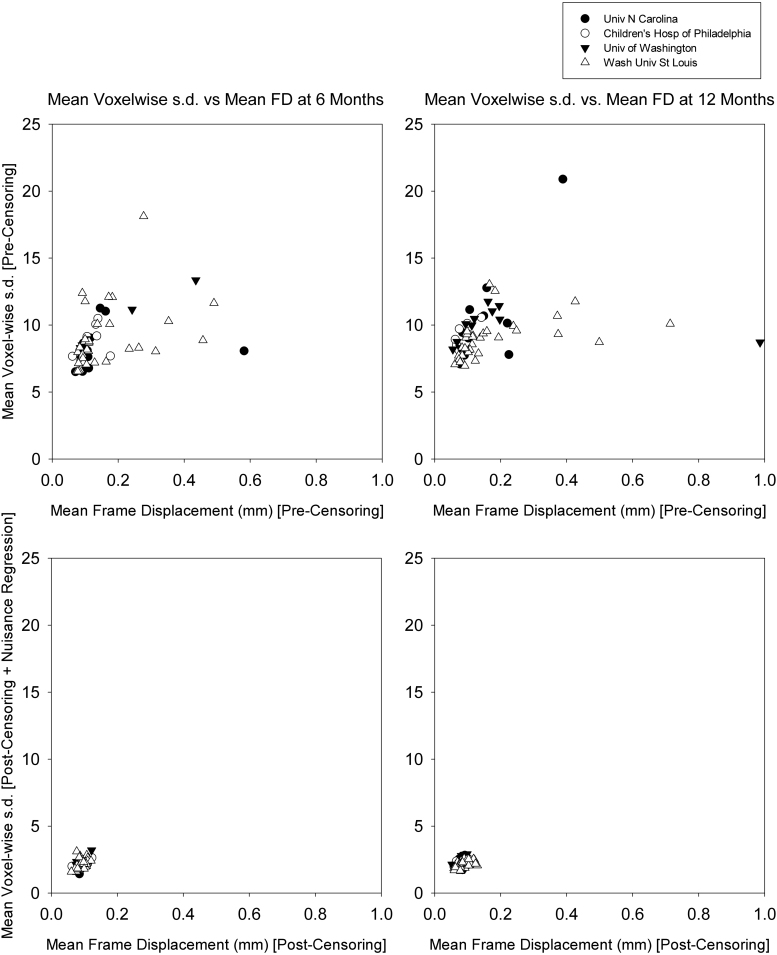
Supplementary Fig. 1.
Quality assurance measures before and after fcMRI preprocessing. Age is displayed by column. Row 1 shows the relationship between mean frame displacement (FD) and mean standard deviation (SD) prior to fcMRI preprocessing. Importantly, there is no visible clustering by site. Row 2 shows mean standard deviation post frame censoring and nuisance regression. Subjects are now clustered together without noticeable signal variance or frame displacement variance.

